
Like all Ruuvi products, Ruuvi Gateway aims to fill two very different use scenarios. Plug and Play users who want a “just works” experience on the one hand, and an enthusiast who wants to experiment, customise and maintain their own systems on the other. This article shows a walkthrough of how to connect a Ruuvi Gateway to a private server using MQTT, NodeJS, InfluxDB and Grafana.
MQTT is used to connect Ruuvi Gateway to a private server, so it is possible to run Ruuvi Cloud in parallel with one gateway device. MQTT also has a continuous connection between the Gateway and the device, which allows the backend to receive every data packet received by the Gateway.
Setting up a private DigitalOcean server for RuuviTags data
While Ruuvi Cloud started as open source, we soon realised that the setup effort and maintenance of a custom solution creates more hassle and is less flexible than a ready-made solution for users who aim to support only their personal sensors. This is why we selected a familiar stack of widely used open source components for our private server instructions over the Ruuvi Cloud clone setup.
These instructions are tested on Debian running on DigitalOcean. Hardware requirements depend on the amount of data being processed, but any 10 – 20 USD instance should be sufficient for a light workload of a few tens of sensors.
Install components for a private server
Mosquitto MQTT broker for Ruuvi gateway
Mosquitto is an open source MQTT broker. We use it to receive messages from the Gateways and relay them to our NodeJS application listening in for processing the data.
To install Mosquitto, run the following:
sudo apt-get install mosquittoNodeJS open source server for running Javascript
NodeJS is an open source server environment which runs Javascript code. We use NodeJS as a glue to connect the components.
NodeJS versions packaged with Debian Package control are quite outdated, so we use Node Source repository to install a recent version of NodeJS. Run in terminal:
sudo apt install curl
curl -fsSL https://deb.nodesource.com/setup_16.x | sudo -E bash -
sudo apt install nodejs
InfluxDB database for RuuviTag sensor IoT data
InfluxDB is a time series database, which means that it is specifically designed to process data which is sorted by increasing timestamps. That is a perfect match for sensor data. While latest InfluxDB is in version 2.X, we’re still using 1.X distributions for compatibility with our glue code.
Influx maintains up-to-date installation instructions at: https://docs.influxdata.com/influxdb/v1.8/introduction/install/#, as of right now you can run:
wget -q https://repos.influxdata.com/influxdb.key

echo '23a1c8836f0afc5ed24e0486339d7cc8f6790b83886c4c96995b88a061c5bb5d influxdb.key' | sha256sum -c && cat influxdb.key | gpg --dearmor | sudo tee /etc/apt/trusted.gpg.d/influxdb.gpg > /dev/null

echo 'deb [signed-by=/etc/apt/trusted.gpg.d/influxdb.gpg] https://repos.influxdata.com/debian stable main' | sudo tee /etc/apt/sources.list.d/influxdata.list

sudo apt-get update && sudo apt-get install influxdb

sudo systemctl unmask influxdb.service

sudo systemctl start influxdb
It should be noted that InfluxDB does not use authentication by default, which means anyone can access your database. Influx maintains instructions for setting up authentication at: https://docs.influxdata.com/influxdb/v1.8/administration/authentication_and_authorization/.
Once Influx DB is running, start Influx terminal and create databases. If you set up authentication, grant your user write access to the databases. For instance, these examples below support some custom dataformats, only the “ruuvi” database is mandatory.
CREATE DATABASE ruuvi
CREATE DATABASE acceleration
CREATE DATABASE fft
If you set up authentication, you can create separate admin, writer and reader users:
CREATE USER admin WITH PASSWORD '<password>' WITH ALL PRIVILEGES
CREATE USER ruuvi_writer WITH PASSWORD '123456'
CREATE USER ruuvi_reader WITH PASSWORD '123456'
GRANT WRITE ON ruuvi TO ruuvi_writer
GRANT READER ON ruuvi TO ruuvi_reader
GRANT WRITE ON fft TO ruuvi_writer
GRANT READER ON fft TO ruuvi_reader
GRANT WRITE ON acceleration TO ruuvi_writer
GRANT READER ON acceleration TO ruuvi_reader
Grafana for visualisation of RuuviTag sensor data
Grafana is a multi-platform open source analytics and interactive visualisation web application. It provides charts, graphs, and alerts for the web …
Wikipedia
In plain English, Grafana is a tool for setting up dashboards for viewing data. You can install it by:
sudo apt-get install -y apt-transport-https

sudo apt-get install -y software-properties-common wget

sudo wget -q -O /usr/share/keyrings/grafana.key https://packages.grafana.com/gpg.key

echo "deb [signed-by=/usr/share/keyrings/grafana.key] https://packages.grafana.com/oss/deb stable main" | sudo tee -a /etc/apt/sources.list.d/grafana.list

echo "deb [signed-by=/usr/share/keyrings/grafana.key] https://packages.grafana.com/oss/deb beta main" | sudo tee -a /etc/apt/sources.list.d/grafana.list

sudo apt-get update

sudo apt-get install grafana
Glue logic
The logic to glue the parts together on server side is in Typescript repository: https://github.com/ojousima/ojousima.mqtt2influx.ts.
You can download the latest code by running the following:
sudo apt-get install git
git clone https://github.com/ojousima/ojousima.mqtt2influx.ts
After cloning the project, you need to set up the credentials and configuration.
cd ojousima.mqtt2influx.ts
cp .env.ts.example .env.ts
nano .env.ts
After you have entered your server URL and passwords, you need to compile and run the project.
npm run-script build
node lib/src/index.js
Once everything is running smoothly, you can leave the glue logic running with “forever”.
sudo npm -i -g forever
forever start lib/src/index.js
Ruuvi Gateway setup for sending data to a private server
Setting up the Ruuvi Gateway is quick through the configuration interface. Proceed through the configuration as usual, and then select Advanced Settings in Cloud options.
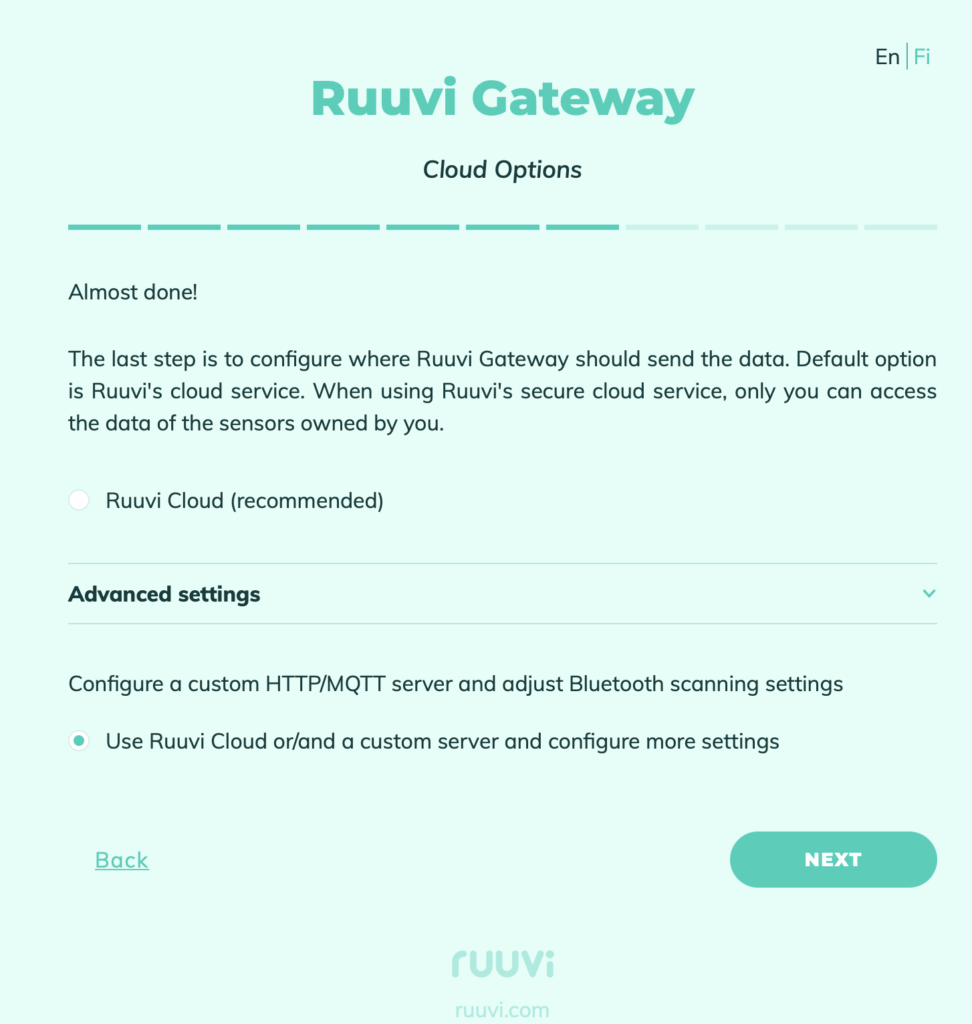
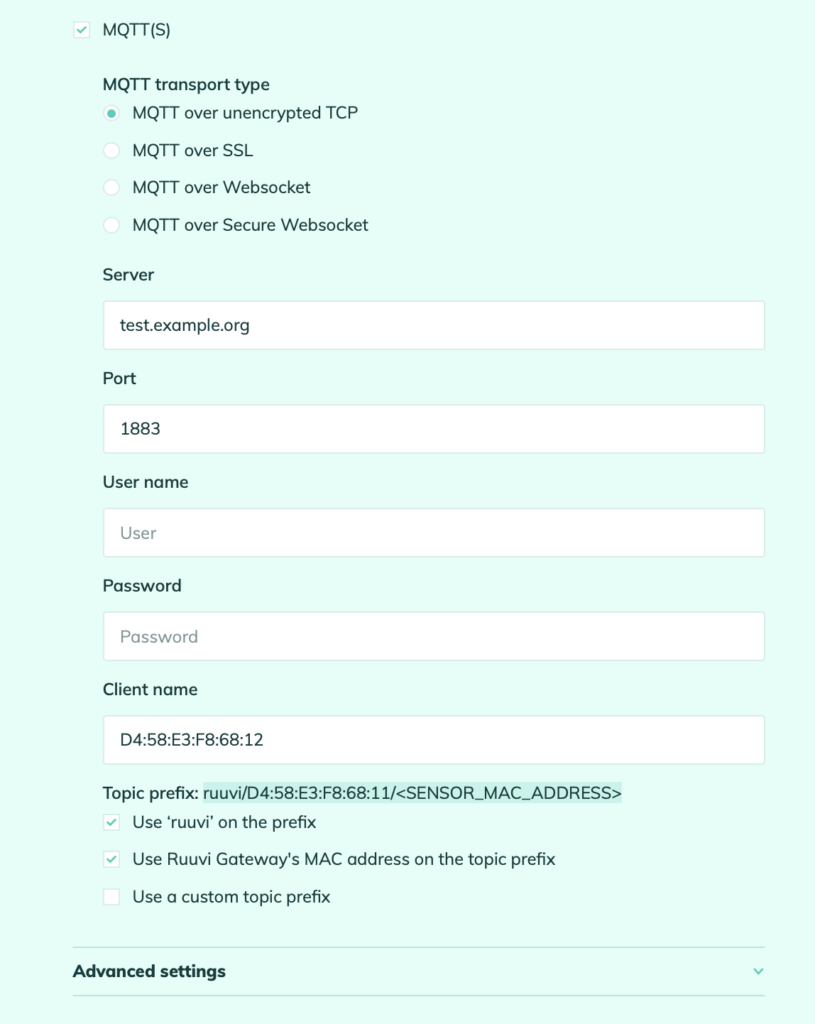
In custom server configuration you can leave HTTP default setting on to keep sending to the Ruuvi Cloud. Check the MQTT(S) box and enter your server details. The glue logic uses prefix ‘ruuvi’ and Gateway ID to assign the measurements by Gateways.
Once you’re done, everything should be ready for you to set up some dashboards.
Setting up dashboards in Grafana for RuuviTag data
Setting up data sources
First thing we need to do is to tell Grafana where the database is and how to connect to it. The glue logic example supports some experimental formats, but we’re going to use only standard Ruuvi data here.
Sign in to Grafana, enter a new admin password if requested and select the gear from the lower left corner. Then pick “Configuration” -> “Data Sources” -> “Add data source”
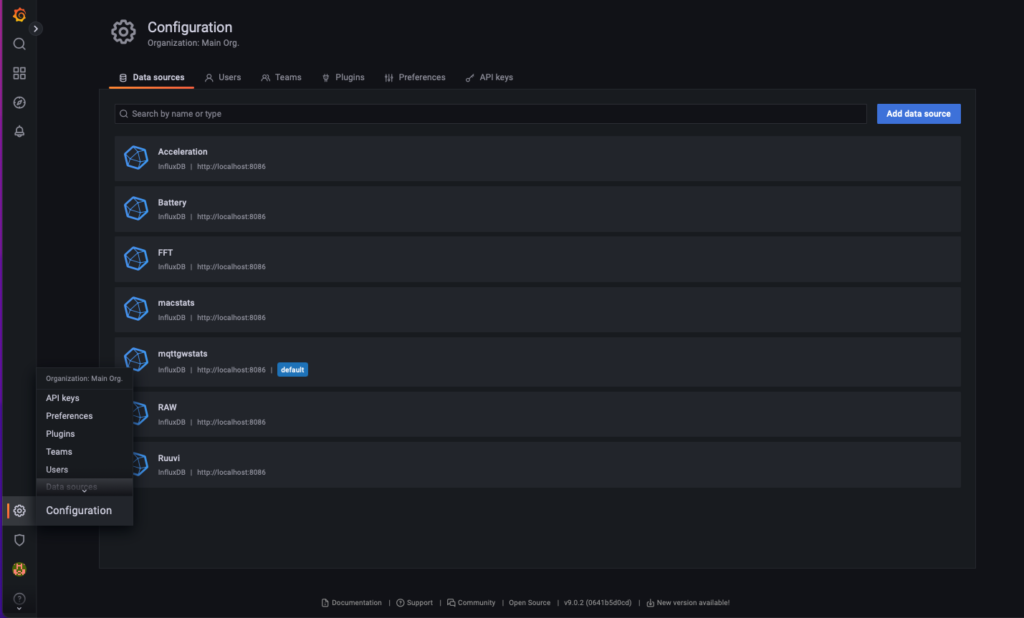
In add data source dialog, select “Influx DB”. If you’re running Grafana and Influx on the same server, use HTTP URL http://localhost:8086 and enter database details. In this example, they would be:
database: ruuvi
user:     ruuvi_reader
password: 123456
Name the data source so that you’ll remember which database it was connected to.
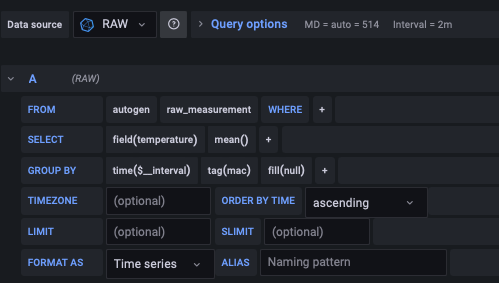
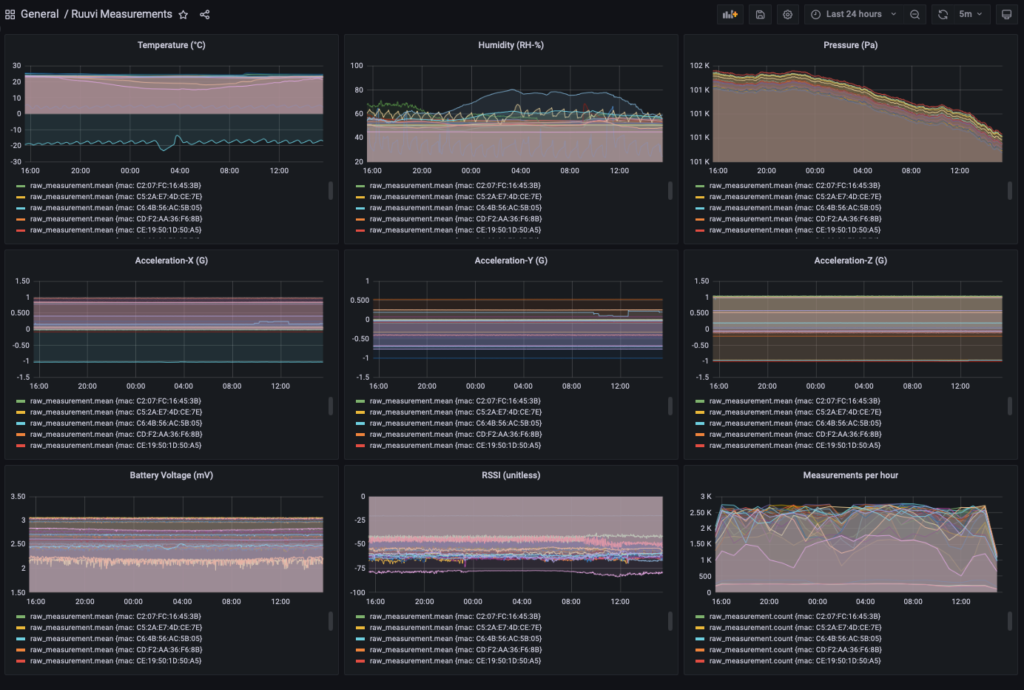
Next, you can create your own dashboard or import one from: https://github.com/ruuvi/ruuvi.grafana-dashboards.json. When importing the dashboards, select Data Source which has the database, which the dashboard uses; for example standard ruuvi measurements use database “raw” if everything is configured as in mqtt2influx project example environment.
Likewise the measurement name has to match in configuration, here it is “raw_measurement”. You can see the dashboard panel configuration by clicking “edit” on panels.
If everything went well, you should now have your Ruuvi Dashboard up and running on your own server.
Troubleshooting the Grafana and Influx DB setup
If you don’t see any data on your dashboard, you can check these things:
Gateway to MQTT broker
Connect to your MQTT broker with a client of your choice. MQTT X is one option, but a lot more exist. Once connected, subscribe to wildcard topic /# and check if there is any activity under “ruuvi” topics. If not, double-check your Gateway configuration, if yes, go on to check the ojousima.mqtt2influx.ts project.
Glue logic
You can run the program in the terminal over SSH and see if any errors pop up. If there are no errors, you can add a console.log -line to src/influx.ts rawToInflux function to see if the project is trying to store data to Influx.
InfluxDB
You can check if there is any data in the InfluxDB by logging in to your server and entering the Influx shell by typing “influx”. After that you can view data in the database by e.g.
USE raw
SHOW SERIES
This should print out the sensors you have in the database, e.g.:
raw_measurement,dataFormat=5,gateway_id=DD:C3:3B:AB:2F:FC,mac=DA:35:40:88:09:7B
raw_measurement,dataFormat=5,gateway_id=DD:C3:3B:AB:2F:FC,mac=E5:83:B4:04:90:52
raw_measurement,dataFormat=5,gateway_id=DD:C3:3B:AB:2F:FC,mac=F6:3A:84:A8:E4:CF
raw_measurement,dataFormat=5,gateway_id=DD:C3:3B:AB:2F:FC,mac=F6:81:DD:6E:FE:D8
raw_measurement,dataFormat=5,gateway_id=DD:C3:3B:AB:2F:FC,mac=FA:60:2B:73:87:E1
raw_measurement,dataFormat=5,gateway_id=E8:CD:63:50:2D:9C,mac=E9:D3:D4:23:A0:EF
raw_measurement,dataFormat=5,gateway_id=E8:CD:63:50:2D:9C,mac=EB:A1:0F:22:E2:20
raw_measurement,dataFormat=5,gateway_id=E8:CD:63:50:2D:9C,mac=F2:DE:8B:DA:AB:AE
Grafana
If everything above seems to be working, check that your Grafana data sources are configured correctly and you have selected time ranges where you should have some data.
Conclusion
Setting up Ruuvi Gateway to relay your own data to your own server is quite straightforward and can be done in a few hours. There are no additional costs from Ruuvi devices, but your server will have some running costs, typically in the 10 – 20 USD per month range.
Now get some Ruuvi Sensors and go measure your world.