The detailed sensor view is accessible by clicking on one of the sensors on the home page. On this view, you will have access to the following things:
Readings & Graphs
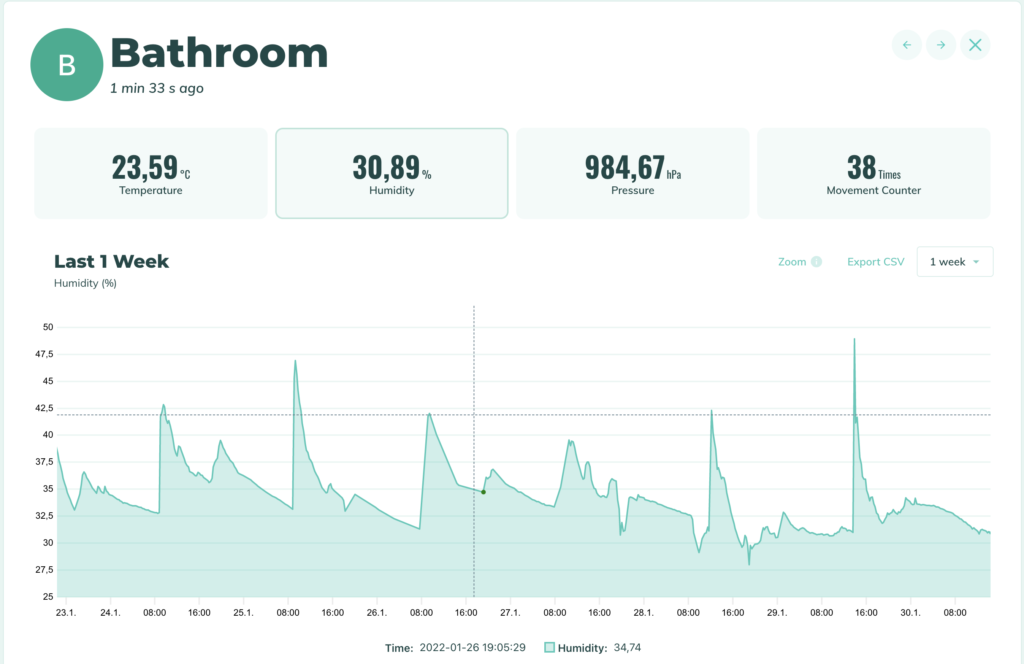
On this section of the page, you will see the readings from the selected sensor. There is also a graph tracing the history of that specific reading. You can easily change from one graph to another by clicking on the desired measurement. In the picture below, the humidity graph is selected and displayed.
By moving on the graph, a cursor will appear, enabling a very precise reading of the values. It is also possible to modify the displayed timeframe in the scroll-down menu at the top right corner of the graph. In the example below it is set to 1 week. You can also zoom in on a specific area of the graph by selecting the desired section of the graph with your mouse. Just double-click to get back to the initial timeframe.
To export the data, just click on “Export CSV”, a data file will be created and automatically downloaded on your computer.
Change from one sensor to another with the arrows in the top right corner.
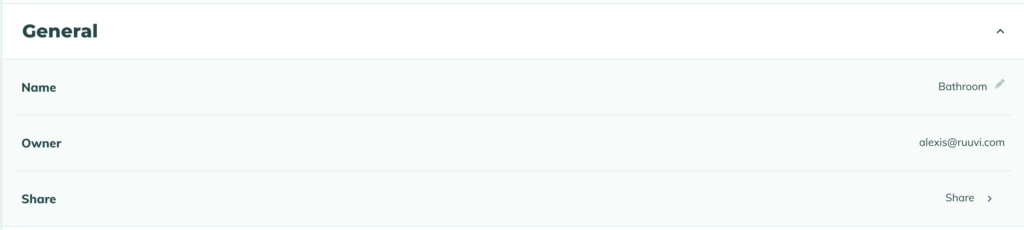
General Settings
In the “General” part of the page you can change the sensor’s name, see who is the owner and share the sensor to any other user.
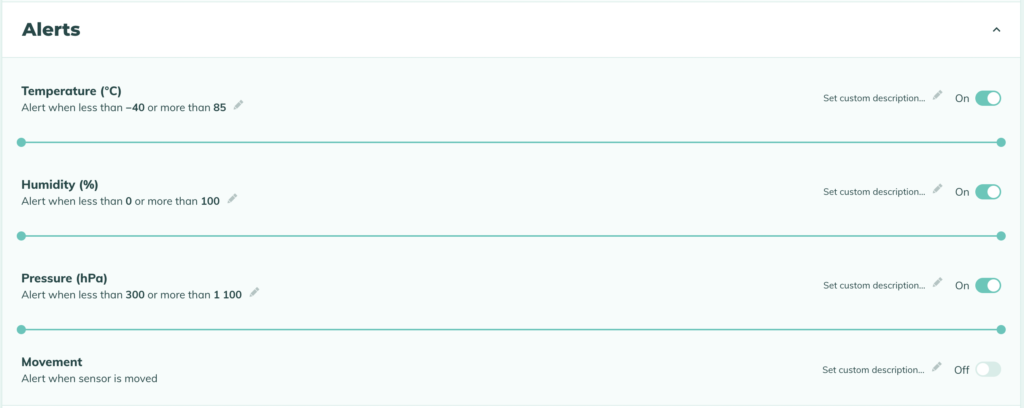
Alerts
In the “Alerts” section of the page, you can define custom alerts for any of the measurements. The alarms are also sensor-specific, meaning that you can set different limits for each of your sensors.
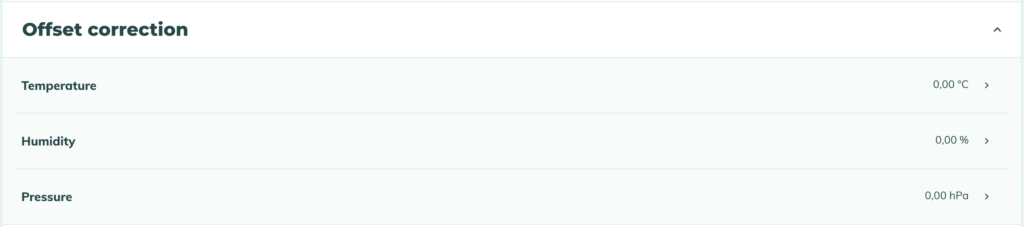
Offset Correction
In normal use, it’s not necessary to adjust the offset. If you’re an advanced user and you’d like to manually configure the factory-calibrated sensors, it’s possible to do so.
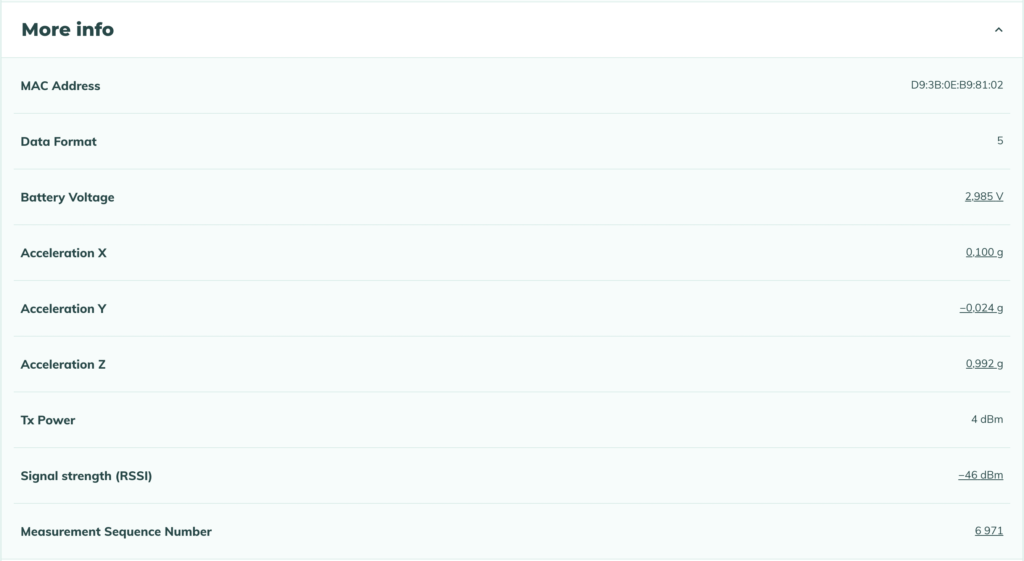
More Info
In the “More info” section of the page, you can see various information related to the sensor. Please note, that a graph is available for all the underlined values. Just click on the underlined value to see the related graph appear above in the graph section.
Remove The Sensor
In the “Remove” section of the page, you can remove the sensor from the app. You can always add it again later.