Ideal sensor would always produce exactly correct result, for example if the temperature is 22.4371 °C (72.38678 °F) we would hope that our sensor would always produce 22.4371 °C as a temperature measurement. However, there are several real-world phenomena which prevent the sensor from producing the desired output.
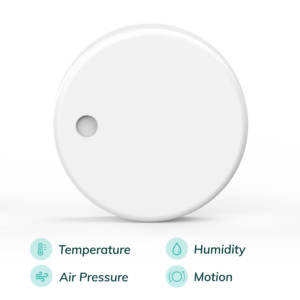
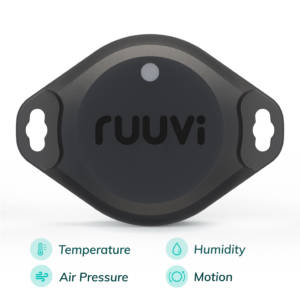
Today we will focus on noise and step response, and take a brief look at resolution, absolute accuracy and power consumption. We’ll use the environmental sensor BME280 on RuuviTag as example.
Let us start with resolution. In above example the “real” temperature is 22.4371 °C, however BME280 onboard RuuviTag can produce only 2 decimals of resolution on temperature, i.e. 22.44 °C with rounding. It is possible to use oversampling and noise to improve on resolution, Wikipedia has an excellent explanation on details. For the purposes of this blog post, we’ll consider the sensor resolution to be a “hard limit” on how good measurement we can obtain.
While our sensor can provide measurements with the resolution of 0.01 °C, absolute accuracy is 0.5 °C at 25 °C and 1.0 °C at 0 … 65 °C. This means that both 21.94 °C and 22.94 °C would be “correct” results for the BME280.
Although two different sensors might disagree by one celsius on the absolute temperature, difference between two samples in the same sensor should be a lot closer to one another. BME280 is specified to have a Root-Mean-Square (RMS) noise of only 0.005 °C. Let us take a look at a simulated measurement series of these two example sensors, one having off set of +0.25 °C and other -0.25 °C
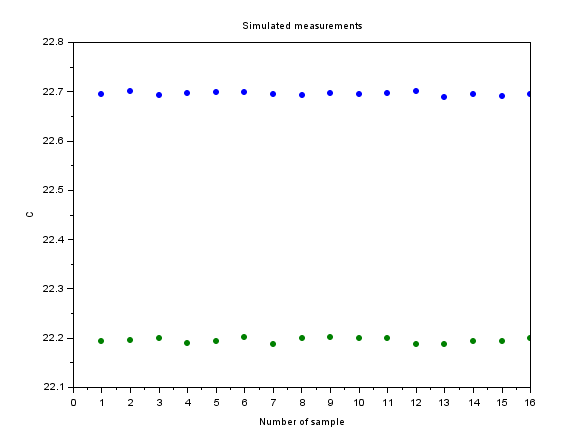
Real temperature is in the middle, but we cannot really know that from the measurements. After all, real temperature could be 22.7 °C, blue line being almost exactly correct and green line being offset by -0.5 °C — or vice versa.
There is no way to improve on absolute accuracy of these measurements. We could get a third sensor, and hope that it is even further away from real temperature, thus limiting the range of real temperature values where all measurements are still valid. However, we can improve on noise using DSP.
The environmental sensor BME280 offers in-built signal processing, namely oversampling (OS) and Infinite Impulse Response (IIR) filtering. Oversampling means taking a series of measurements in a rapid succession and averaging those. If there is random noise in measurement (and there always is) the noise is getting averaged out. IIR means “carrying” history of previous measurements to new measurement. While IIR can be used to implement many different filters, BME280 has low-pass filter which means that fast changes in signal are suppressed. Since low-passed signal cannot change quickly, the noise is reduced.
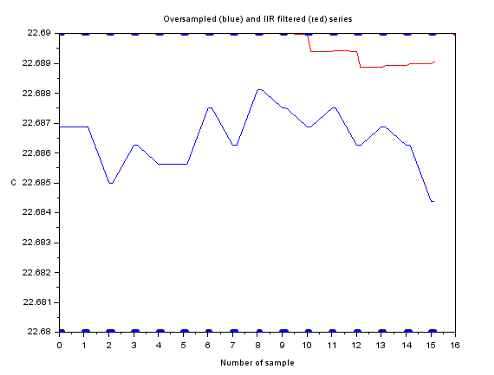
Let us zoom in on blue signal above, and look at IIR and OS on the signal.
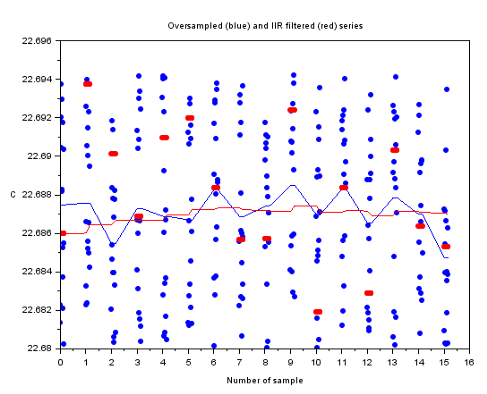
We recall that the “real” temperature was 22.4371 °C and offset was 0.25 °C. Therefore the average reported temperature should be near 22.687, and this seems to match very well to the result seen in lines. It should be noted that this simulation was not rounded to the resolution of BME280, however the result stands even if rounding is done:
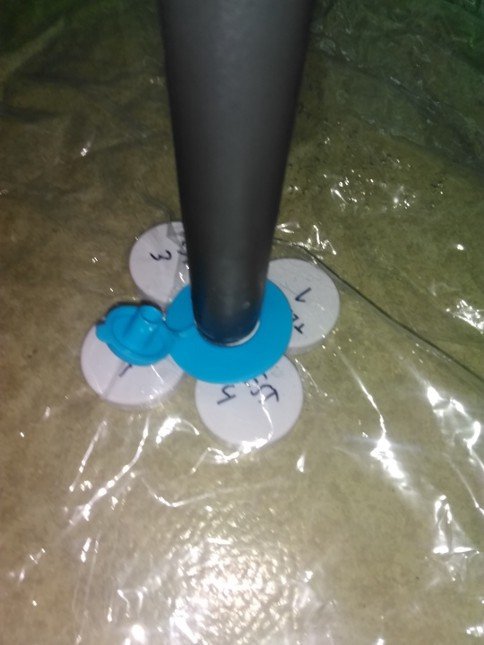
Armed with the theoretical knowledge of oversampling and IIR, let us move to practical testing using vacuum cleaner, vacuum bag and RuuviTags configured with various oversampling and IIR rates.
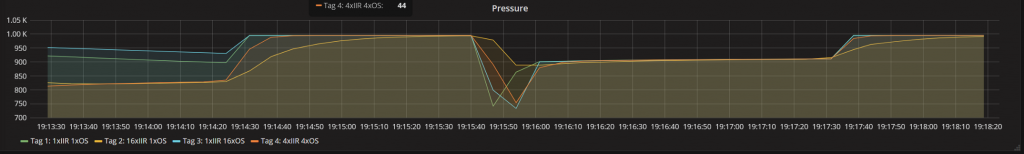
As expected, IIR sampling slows down the response. However, any noise cannot be seen in this image, since relative changes are so large. To look at noise, let us check the standard deviation of the measurements over longer period.
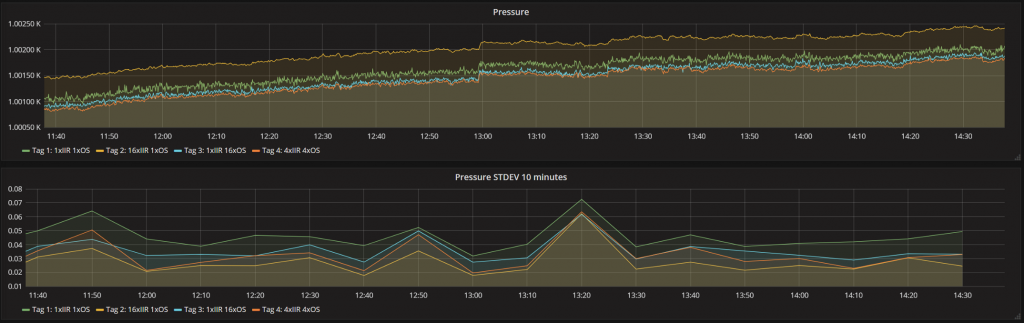
Visually it looks like that the 16x oversampling graph is “cleanest” with least ripples along it. Standard deviation graph seems to confirm this intuitive result, standard deviation is lowest i.e. the measurements differ least from one another.
Final consideration is the power consumption. Oversampling literally means taking extra samples, and every action costs energy. The programs were power profiled, and the 16x oversampling program was found to use 20 µA more on average. Therefore unless fast response times are required, IIR suits Ruuvi’s use case of stationary sensor better.
The takeaway from these experiments is that everything is a compromise. Noise of measurements can be reduced in many ways, such as OS or IIR. However both methods come with a cost: OS consumes more power and IIR increases the response time of sensor. There is no ideal or “best” algorithm, DSP methods used must be fitted to application.