Another neat feature in Ruuvi Station is the History view, which allows you to explore the recorded sensor values in graphical form.
To access this feature on mobile, select History view from the three-dot menu (dashboard), tap on sensor card when Open history view is selected in View menu (dashboard) or tap on the graphs icon (full image view) on Sensor Card.
To access this feature on web, select History view from the three-dot menu (dashboard) or tap on sensor card (dashboard) to view full sensor card with history view.
Ruuvi Station mobile allows you to view maximum of 10 days of measurement history. In Ruuvi Station web app you will be able to view up to 2 years of history. Available history length on web app depends on your Ruuvi Cloud subscription level.
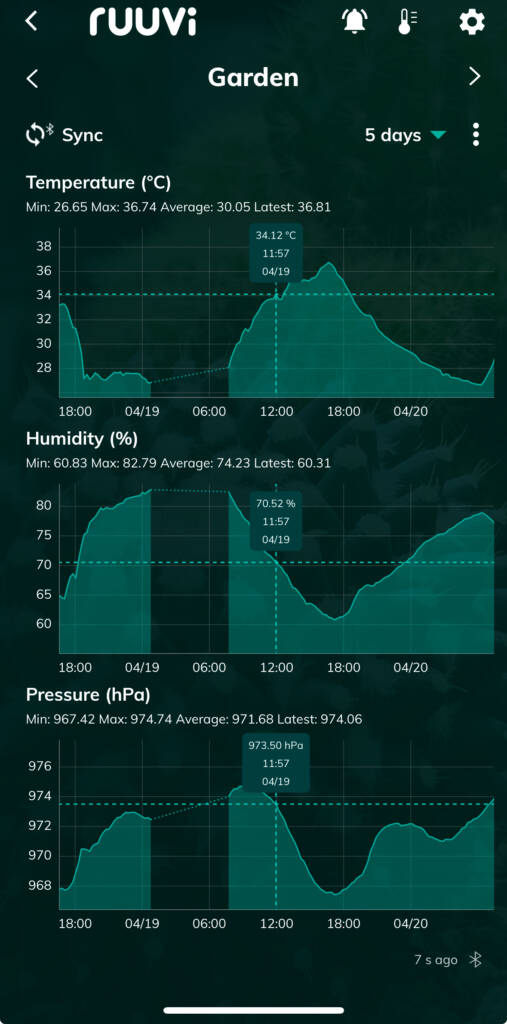
The history view page shows individual XY-axis grids for each of the measurements. You will be able to explore various graphs such as temperature, air humidity and air pressure, depending on which measurement components are available on your Ruuvi Sensor.
The Y-axis shows the recorded range for each, while the X-axis shows the time of recording according to the local time zone settings on your mobile device.
Important notice: not all our Ruuvi Sensors are equipped with the same measurement components. For example, if you have a RuuviTag Pro 2-in-1 that measures only movements and temperature, humidity and air pressure readings will remain empty and are hidden from view. Read more about the different sensors and their components here.