
What we’re looking for?
A lot of people ask us for some more advanced uses for accelerometer onboard RuuviTag. One such use is to monitor vibrations to determine if machine is on or off and even to do some predictive maintenance on machinery.
Instead of just rushing off to sprinkle RuuviTags here and there it’s important to determine what kind of signals there are and how we should process them. To get started we’ll sample a series of raw acceleration data from a running laundromat.
My initial assumption is that we’re going to find two main frequencies of interest: The drum rotation at 600 RPM (or 10 Hz) and 50 Hz of European mains frequency. We’ll also want to take a look at the third harmonic of the mains frequency, which is at 150 Hz. To sample signal at 150 Hz, we’ll need to sample the accelerometer at at least 300 Hz according to Shannon-Nyquist theorem. The next value of LIS2DH12 onboard RuuviTag is 400 Hz, so we’ll pick 400 Hz as our sampling frequency.
The 12-bit resolution of LIS2DH12 limits the acceleration bandwidth to 1/9 of sampling frequency, so we’ll use the 10-bit mode. At 10 bit resolution and 2 G scale, we have one bit for sign and 9 bits for amplitude. This gives us resolution of 4 mG / bit.
As we don’t really need to include the gravity on our data, we can apply the built-in high-pass filter of LIS2DH12 to get only vibration in our signal. We can squeeze the data a bit by clipping it at 8 bits, including a sign. This gives us amplitude of +- 0.5 G which should be more than enough — but we’ll see soon enough.
Our data rate is therefore going to be 3 * 400 bytes per second, or 1.2 kBps. This should be streamable over GATT. Let’s give it a go.
Modifying application to stream the data
The process to create a custom firmware is the same as in the battery data collector. This time we also need to modify the drivers a bit: namely the LIS2DH12 driver supports sample rate of only 200 Hz.
diff interfaces/acceleration/ruuvi_interface_lis2dh12.c
diff --git a/interfaces/acceleration/ruuvi_interface_lis2dh12.c b/interfaces/acceleration/ruuvi_interface_lis2dh12.c
index 1913d9c..083fcc9 100644
--- a/interfaces/acceleration/ruuvi_interface_lis2dh12.c
+++ b/interfaces/acceleration/ruuvi_interface_lis2dh12.c
@@ -235,7 +235,7 @@ ruuvi_driver_status_t ruuvi_interface_lis2dh12_samplerate_set(uint8_t* samplerat

   if(RUUVI_DRIVER_SENSOR_CFG_NO_CHANGE == *samplerate)   {}
   else if(RUUVI_DRIVER_SENSOR_CFG_MIN == *samplerate)    { dev.samplerate = LIS2DH12_ODR_1Hz;   }
-  else if(RUUVI_DRIVER_SENSOR_CFG_MAX == *samplerate)    { dev.samplerate = LIS2DH12_ODR_200Hz; }
+  else if(RUUVI_DRIVER_SENSOR_CFG_MAX == *samplerate)    { dev.samplerate = LIS2DH12_ODR_400Hz; }
   else if(RUUVI_DRIVER_SENSOR_CFG_DEFAULT == *samplerate){ dev.samplerate = LIS2DH12_ODR_1Hz;   }
   else if(1   == *samplerate)                            { dev.samplerate = LIS2DH12_ODR_1Hz;   }
   else if(10  >= *samplerate)                            { dev.samplerate = LIS2DH12_ODR_10Hz;  }
@@ -288,6 +288,10 @@ ruuvi_driver_status_t ruuvi_interface_lis2dh12_samplerate_get(uint8_t* samplerat
       *samplerate = 200;
       break;

+    case LIS2DH12_ODR_400Hz:
+      *samplerate = RUUVI_DRIVER_SENSOR_CFG_MAX;
+      break;
+
     default:
       *samplerate = RUUVI_DRIVER_SENSOR_ERR_NOT_SUPPORTED;
err_code |= RUUVI_DRIVER_ERROR_INTERNAL;The we configure the accelerometer to use HIGH_PASS filtering and 400 Hz samplerate in application_config.h
/**
 * Accelerometer configuration
 **/
#ifndef APPLICATION_ACCELERATION_CONFIGURED
  // 1, 10, 25, 50, 100, 200 for LIS2DH12
  #define APPLICATION_ACCELEROMETER_SAMPLERATE RUUVI_DRIVER_SENSOR_CFG_MAX

  // 8, 10, 12 for LIS2DH12
  #define APPLICATION_ACCELEROMETER_RESOLUTION 10

  // 2, 4, 8, 16 for LIS2DH12
  #define APPLICATION_ACCELEROMETER_SCALE   RUUVI_DRIVER_SENSOR_CFG_MIN

  // LAST or HIGH_PASS
  #define APPLICATION_ACCELEROMETER_DSPFUNC RUUVI_DRIVER_SENSOR_DSP_HIGH_PASS
  #define APPLICATION_ACCELEROMETER_DSPPARAM 1

  // SLEEP or CONTINUOUS
  #define APPLICATION_ACCELEROMETER_MODE RUUVI_DRIVER_SENSOR_CFG_CONTINUOUS

  // Up to scale
  #define APPLICATION_ACCELEROMETER_ACTIVITY_THRESHOLD 0.100f
#endifTransmitting all the data takes some thought. We add a ringbuffer which stores samples to be sent and a task to process samples out of the ringbuffer. This allows us to have a little leeway in our data transmission, we can store a few FIFO-buffers of the accelerometer in the RAM of the tag and process them later.
The data format is simple: We clip the data into +- 125 range, and set the unit as 4 mG per bit. Then we add X- Y- and Z -axes values in 6 sets per transmission, for total 18 bytes per transmission.
As the ADC is not needed for this application, we remove the ADC sampling after radio transmissions. We also setup maximum connection interval to 15 ms in application_config.h
To collect the data, we use Nordic’s nRF Connect and nRF Logger. We scan for tag “Ruuvi”, make connection, and register to incoming notifications of Nordic UART Service TX characteristic.
Parsing the data out of nRF Logger log takes a bit work: Essentially we RegEx anything that is not 18 bytes separated by dashes out, and then we replace three bytes with a trailing dash with the bytes, separated by dash, and a newline. This leaves us 3 columns which have X-, Y- and Z -axes in 8-bit signed integer, in 4 mG units. Finally we replace the dashes with commas to load the data in Scilab.
First RegEx matches a line with the hex data, we store only the capture group on line. Second line matches everything but the hex data, we can delete those lines. Personally I used Sublime Text’s search and replace, Sed would of course be easier to replicate here.
.*\(0x\) (..-..-..-..-..-..-..-..-..-..-..-..-..-..-..-..-..-..)
^(?!(..-..-..-..-..-..-..-..-..-..-..-..-..-..-..-..-..-..)).*
The we need to actually plot the data. Scilab handles the hex strings as unsigned, so we have to convert them to signed values after load.
strings = read_csv("data.csv");
numbers = hex2dec(strings);
[rows cols] = size(numbers);
for i=1:rows
for j=1:cols
if(numbers(i,j) > 127)
numbers(i,j) = numbers(i,j) -256;
end
end
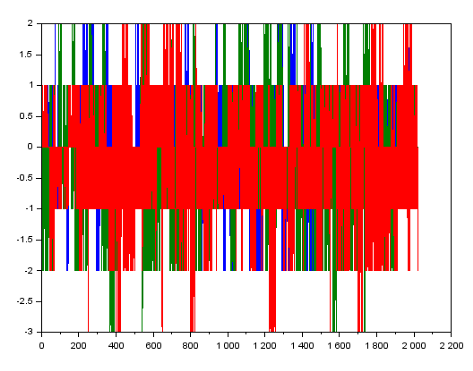
endplot(numbers);And here we are with data from a still tag. The data shows some noise, up to 2 LSB or 12 mG.
Let’s see how it looks while being held on hand.
So far, so good.
Let’s start measuring
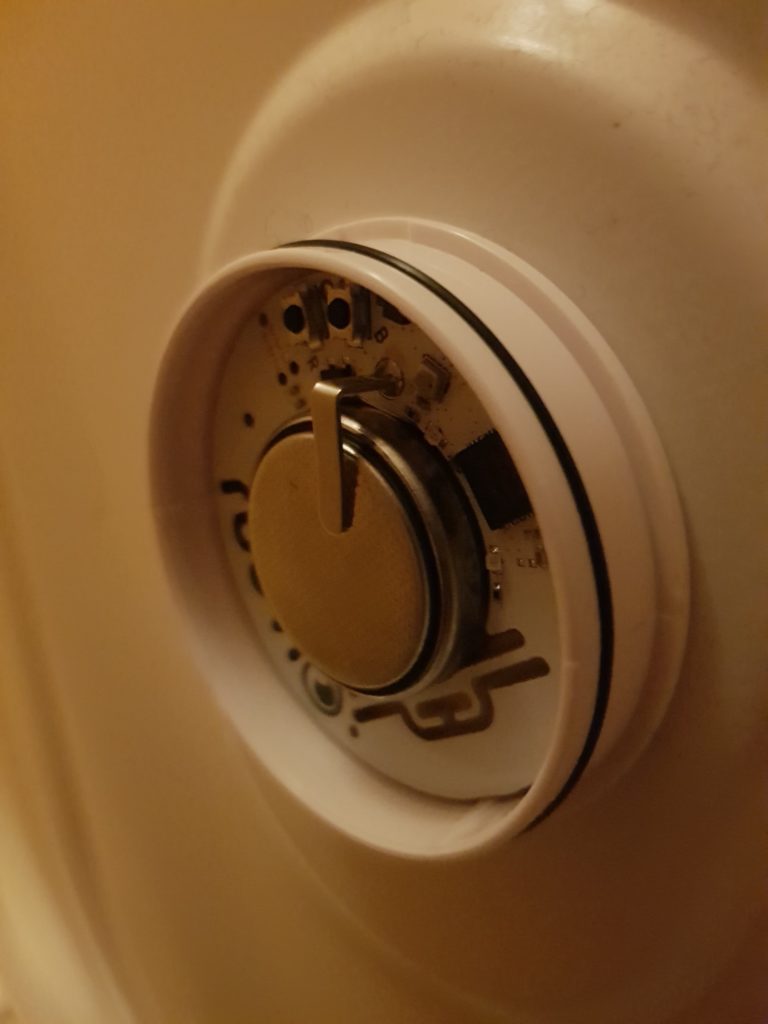
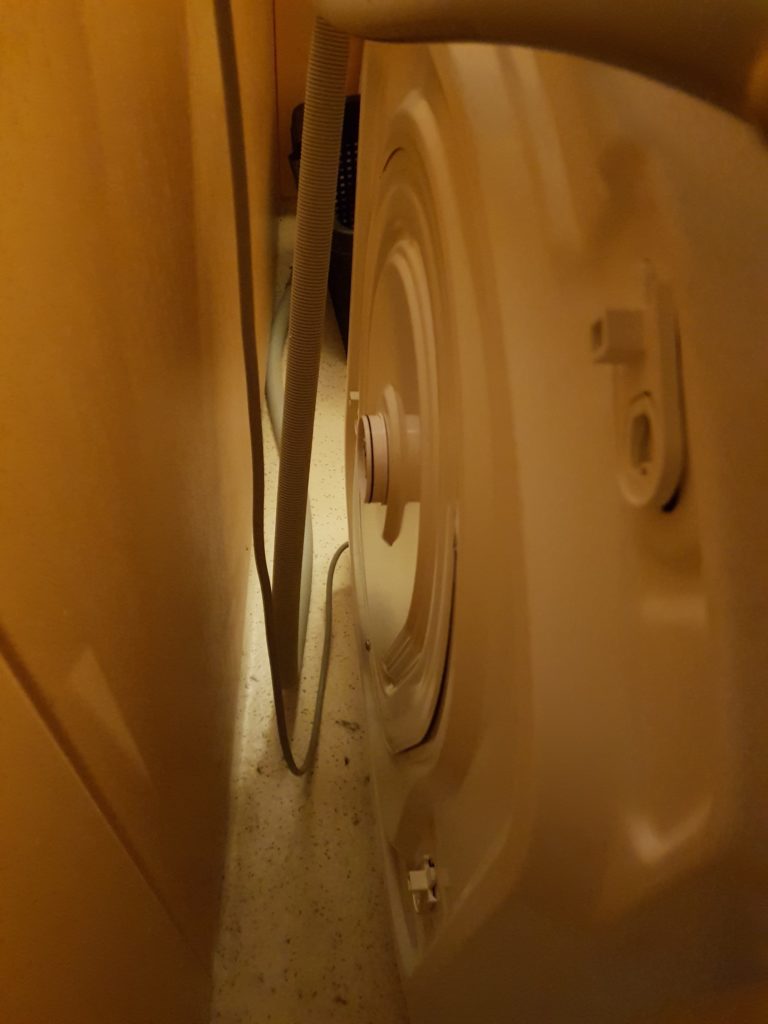
There is a nice, even surface in the middle of the backplate of my laundromat, lets collect our data from there. The Tag is attached with a 3M VHB double-sided tape.
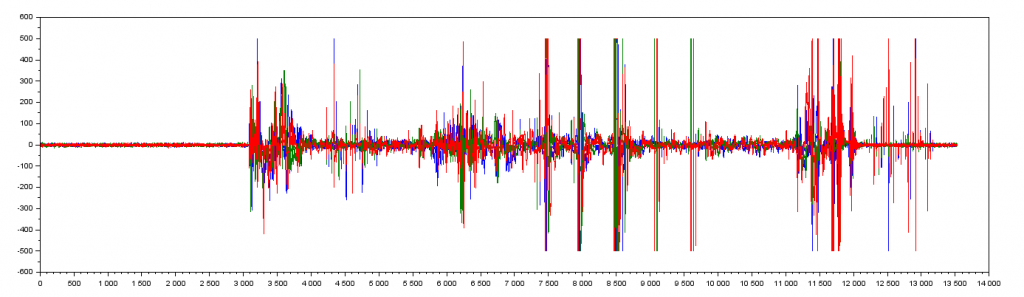
We run a 13-minute drying program which spins the drum. Lets see how the data looks like:
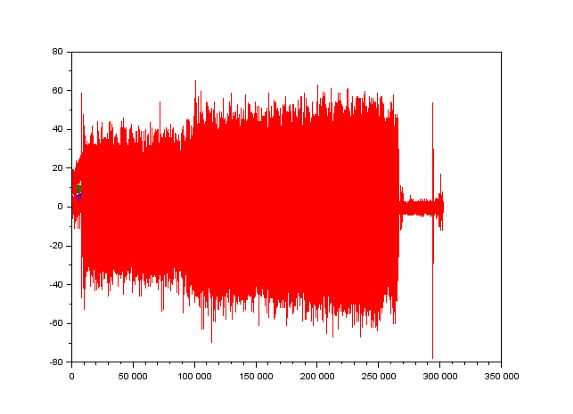
A quick view confirms that our scale setting was well made, the vibration is under 80 mG at all times so we’re not in a danger of clipping. Lets do some analysis to see if we could glean anything further out of data.
First, we split the data into 30-sample chunks and calculate RMS of the chunks. Scilab does not have a ready-made function for this, but porting a Matlab-community script is a breeze.
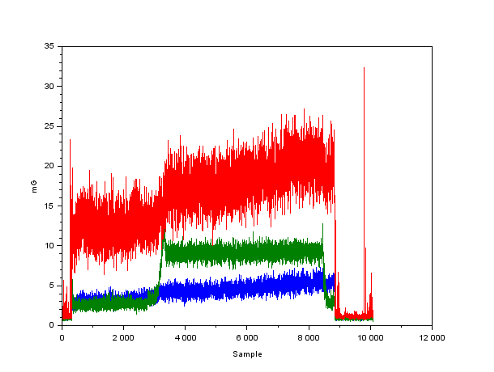
Somewhat curiously, Z-axis i.e. outwards of the drum has most acceleration. Maybe this is because there is no supporting structure? Likewise I was expecting that X- and Y -axes would be identical, but they have different amplitudes and even different behavior: Acceleration of the drum can be clearly seen near series 3000 on red and green lines, but not on blue.
The blue amplitude seems to be steadily growing: maybe this is due to laundry drying out, becoming lighter and allowing more movement?
Finally, the staple of signal analysis: FFT. In this case we’re taking a shortcut and running the FFT over entire signal, which is somewhat dishonest as there’s at least 5 distinctive phases in the program.
- Start (still)
- Start(accelerating)
- Run (full speed)
- Stop
- Open hatch
Now all these signal get mashed up into one. Regardless, following this link on FFT generation and this link on amplitude normalizing we get some representation of the frequencies in the acceleration.
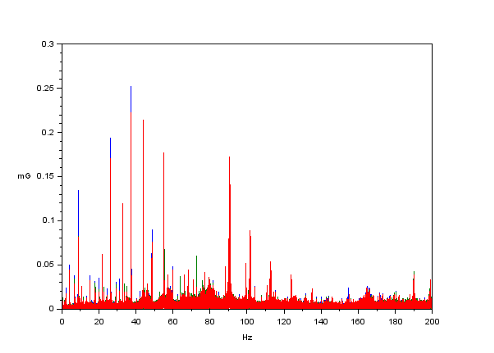
However this data does not really tell us much. is 0.25 mG of acceleration at 45 Hz a lot? Is it bad? Is it good? Was it always there? Lets dig deeper with spectograms. While Scilab has Time-Frequency Toolbox with support for spectograms, I didn’t manage to install it due to some missing .DLLs. Therefore we go to Octave:
numbers = csvread("csvout.csv");
Fs = 400;
window = ceil(100*Fs/1000);
pkg load signal;
t = 0:1/Fs:(length(numbers(:,1))-1)/Fs;subplot(2, 2, 1);
width = 0.1;
rc = 5e-3;
[wx w] = movingrms(numbers, width, rc, Fs);
plot(t, wx);
subplot(2, 2, 2);
specgram(numbers(:,1), 2^nextpow2(window), Fs, window);
subplot(2, 2, 3);
specgram(numbers(:,2), 2^nextpow2(window), Fs, window);
subplot(2, 2, 4);
specgram(numbers(:,3), 2^nextpow2(window), Fs, window);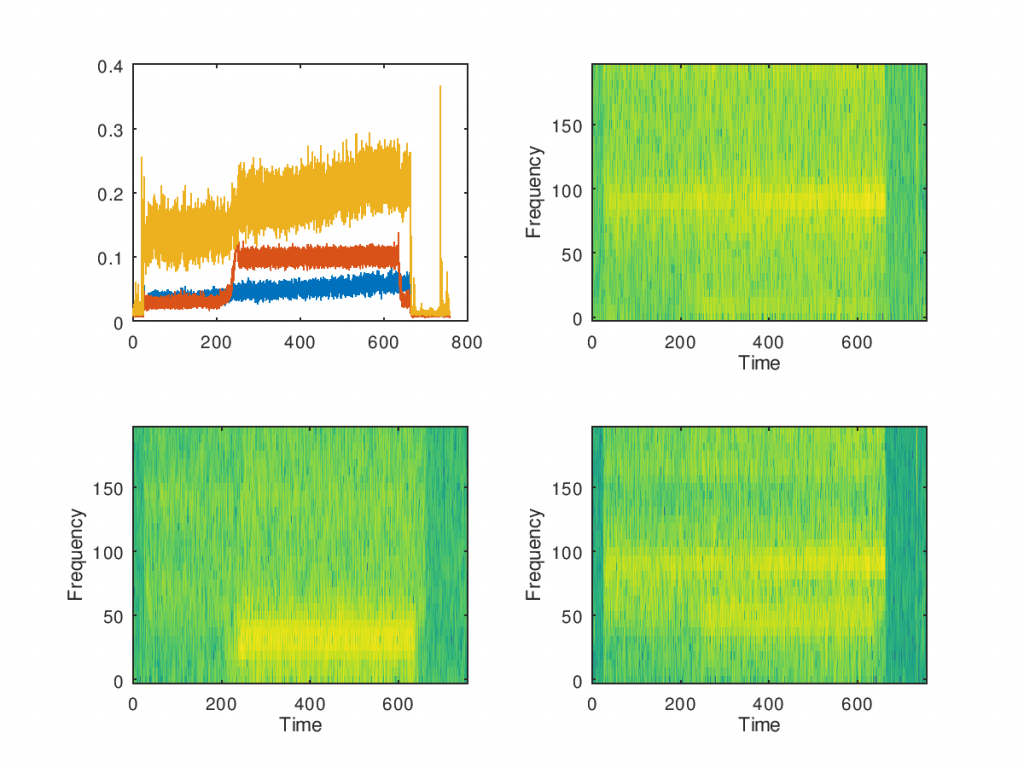
So what do these spectograms tell us? Personally I don’t see anything really curious in data, although I was expecting the 600 RPM to be more pronounced. It seems that the main components are in range of bit below 50 Hz and bit under 100 Hz, chances are that they’re related to each other via some harmonic interaction. I’m not mechanical engineer though, so chime in if you have ideas on what the data tells us.
In conclusion
We have now firmware and algorithms for reading vibration data out of machinery. However we know only what a “healthy” machine looks like, next step would be to intentionally wear out some machinery so we can identify the signal which precedes its breakdown and develop an algorithm to monitor for the condition within the RuuviTag itself.
Software developed here won’t be available as a DFU package as it builds on Nordic SDK15.2 while RuuviTags ship with SDK12.3, but we’ll publish the sources and compiled binary so you can flash it on your tag if you have wired connection.
If you want to develop a business based on predictive maintenance contact us on info@ruuvi.com and we can help you get started!