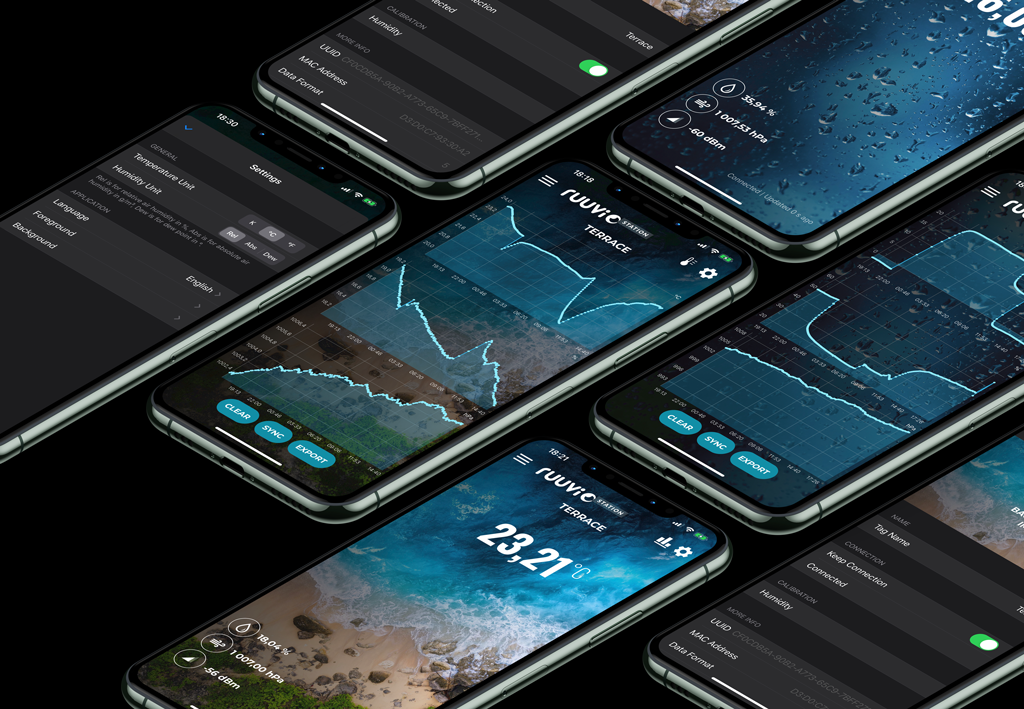
iOS has known limitations for listening to Bluetooth advertisements in background. That’s why we didn’t ship charts feature in earlier versions of Ruuvi Station. The solution for this issue is more complex than just writing code on iOS client side. What needs to be done in order to deliver this feature? Brand new connectable firmware together with next app version brings charts and export CSV features on your devices. We’ll describe how use it with your RuuviTag in this article, but first, let’s review some other changes made in Ruuvi Station iOS 0.4.
Dark Mode
iOS 13 brings lots of new features to the users, including Dark Mode system setting. Prior to iOS 13, we had one option for look and feel of the Ruuvi Station app: Light Mode.
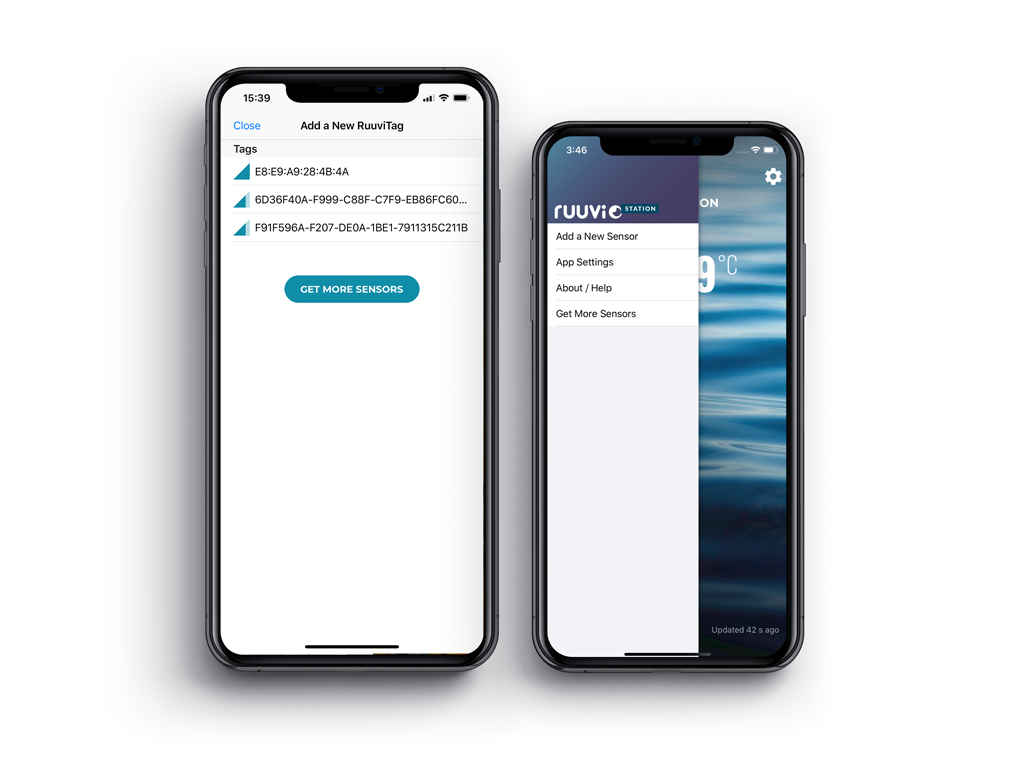
With Ruuvi Station 0.4 we are now supporting Dark Mode.
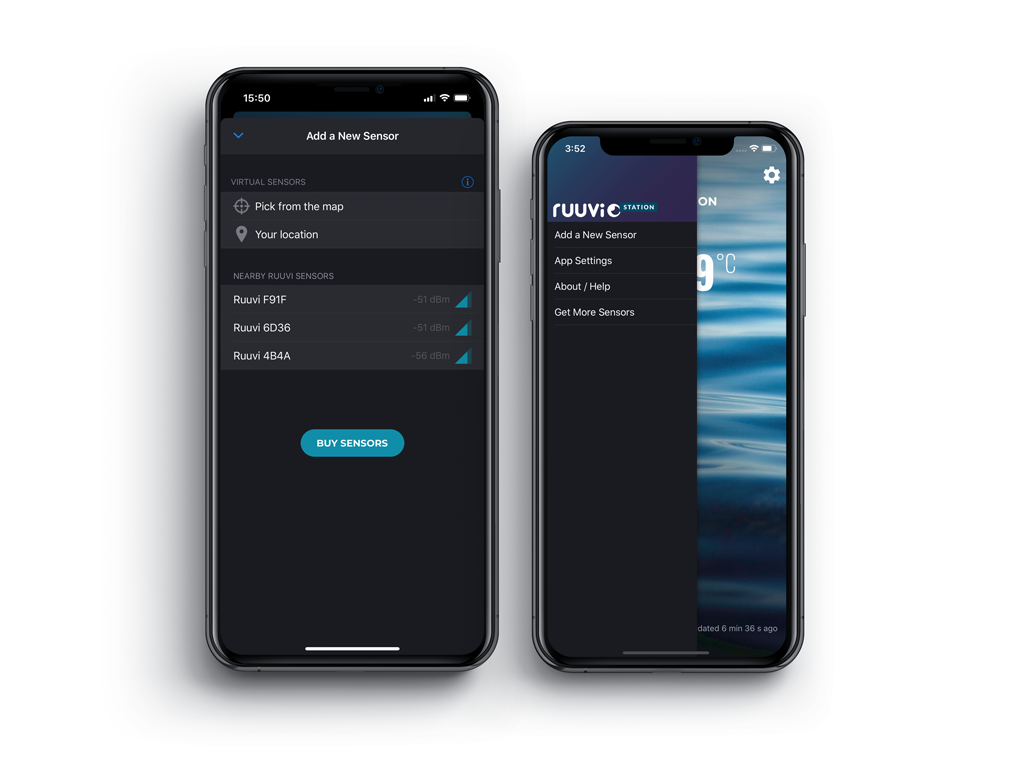
As you can see, the “Add a New Sensor” screen significantly changed. We are happy to introduce Virtual Sensors.
Virtual Sensors
Another source of environmental data is web weather data providers. Specifically, we are utilizing the power of OpenWeatherMap API. You can set up any place in the world and add a Virtual Tag to the Ruuvi Station.
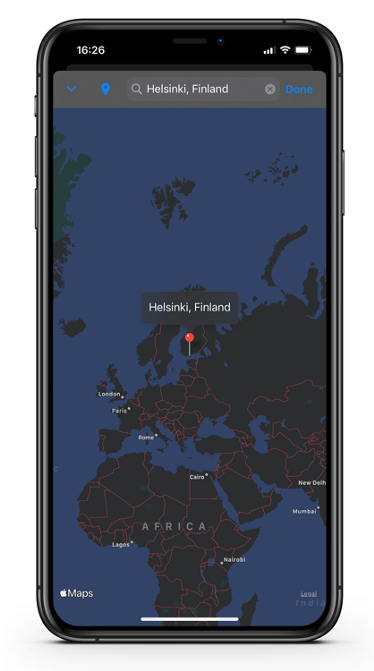
Also you can select “Your location” Virtual Tag, allow the app to determine your current geo position, and get environmental data for your live location.
Other minor features include localization to Finnish and Russian languages, Kelvin temperature unit, iOS 13 page sheet style for presented screens, push notifications for news and updates, export history to CSV and…
Charts
Finally, we are happy to introduce charts for connectable firmware. Limitation — charts feature works only after RuuviTag firmware update.
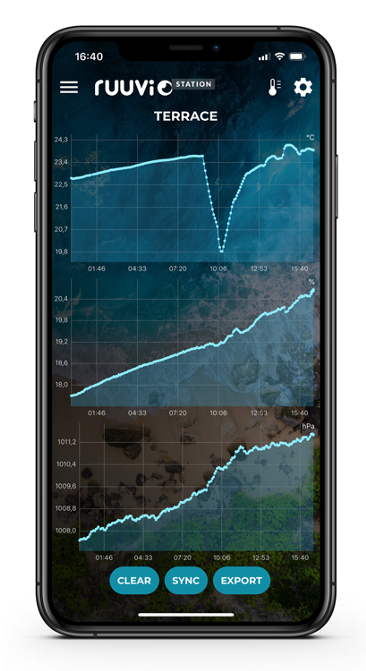
In order to enable charts button for your RuuviTag, you need to update firmware to 3.28.12. Note! Please follow these instructions to update firmware to RuuviTag. Currently it’s not possible to install an official production firmware after version 3.28.12 has been updated. Please note that after the update, special Eddystone and Espruino firmwares cannot be used without using Ruuvi Devkit for the updade.
Background logging
Prior to version 0.4 and connectable firmware, it was impossible to listen to RuuviTag advertisements while the iOS app was in background.
Now it’s working. Just toggle “Keep connection” on the tag settings screen and minimize the app. The data will be saved in background with the App Settings/Background/Data Logging Interval.
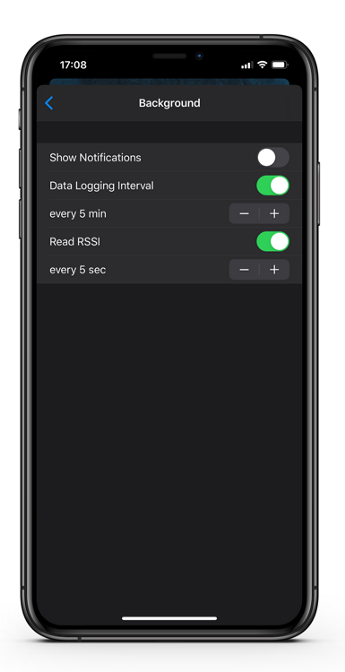
This feature has known limitations. When you are connected to the tag from your iPhone, your iPad won’t receive RuuviTag advertisements. After establishing connection, the tag stops to advertise and serves for one client only. This will be fixed in future firmware versions. Also, reading RSSI values should be done periodically, and this is also configurable in Settings. If you forcibly kill the app using iOS, the data logging will stop working.
Important note: power consumption while being connected is high, and the battery life is expected to be <6 months in connected mode.
Final thoughts
You can update the firmware on your RuuviTag and utilize the power of background logging, charts and export CSV features, especially if you are an enthusiastic user. If you don’t want to risk, you can try Dark Mode and Virtual Sensors.
Would you like to have one?
Ruuvi is an easy way to measure environment at your home, hobbies or business. Order now and get hooked with measuring!