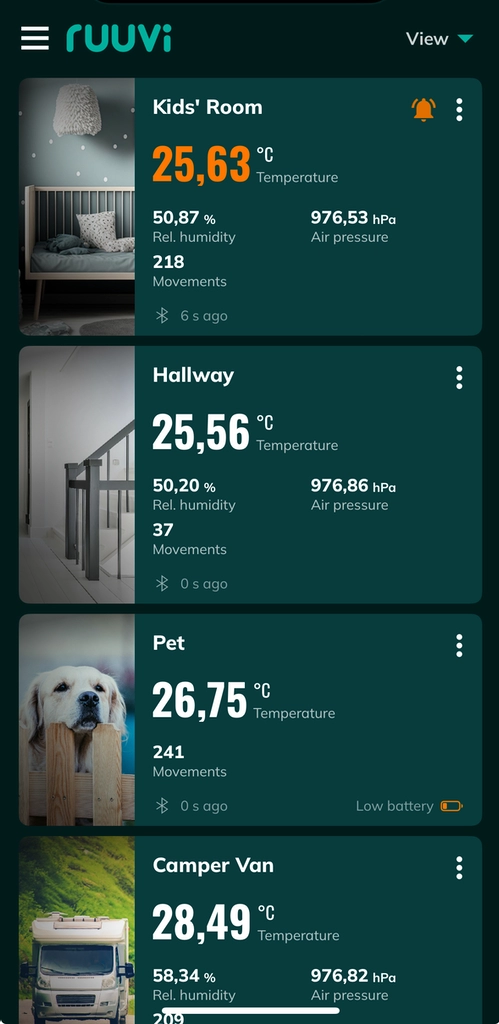
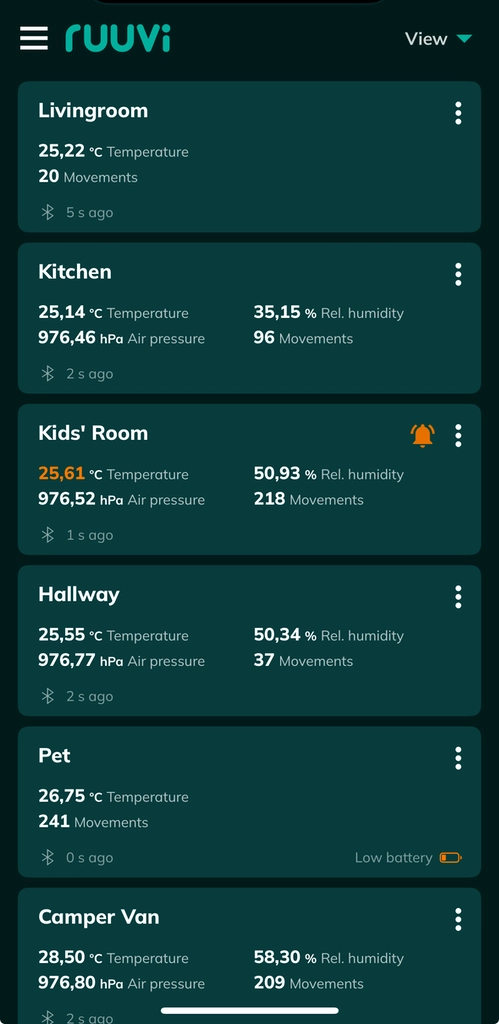
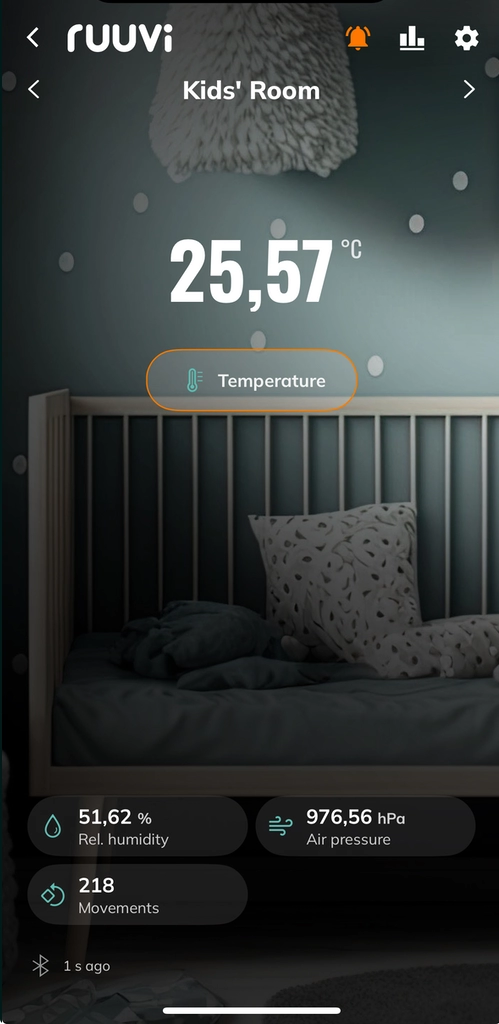
All sensor card views share a set of displayed information depending on the selected view and type of sensor added.
Sensor card details in Ruuvi Station mobile
Image view (dashboard)

- Sensor background image
- Sensor name
- Alert indicator
- Temperature
- Relative air humidity
- Air pressure
- Movement
- Update time
- Battery status indicator
Simple view (dashboard)

- Sensor name
- Alert indicator
- Temperature
- Relative air humidity
- Air pressure
- Movement
- Update time
- Battery status indicator
Full image view

- Sensor background image
- Sensor name
- Alert indicator
- Temperature
- Relative air humidity
- Air pressure
- Movement
- Update time
- Data source
Important notice: not all our Ruuvi Sensors are equipped with the same measurement components. For example, if you have a RuuviTag Pro 2-in-1 that measures only movements and temperature, humidity and air pressure readings will remain empty and are hidden from view. Read more about the different sensors and their components here.
Every individual sensor card has multiple configurable settings, such as name, background image, ownership and sharing settings, alerts and offset correction. These are managed on the sensor settings page.
History view
Tap on the graphs icon (full image view) or choose History view from three-dot menu (dashboard views) to view the sensor history. On full image view tap on the graphs icon to toggle between sensor card view and history view.
Alerts
Each sensor can alert about a set limit being reached. Choose Settings and alerts from the three-dot menu (dashboard views) or tap on the cogwheel or bell icon (full image view) to view alert settings on Sensor Settings page.
Alert indications
If any pre-configured alert gets triggered, an alert will be displayed on the sensor card to indicate this. Additionally, an alert notification will be shown in the notifications center when the app is minimised and running in the background. Every alert notification contains additional information about the alert, such as sensor name, triggered limit and custom message.
When you have Ruuvi Cloud Basic or higher subscription level, an alert coming from Ruuvi Cloud will trigger a push notification. Subscribers that have Ruuvi Cloud Pro or higher will also receive an email notification sent to the email address associated with your Ruuvi account.
Sensor card details in Ruuvi Station web
Image view (dashboard)
- Sensor background image
- Sensor name
- Alert indicator
- Three-dots menu
- Up to 4 sensor values organised by selected view
- Update time
- Battery status indicator
Simple view (dashboard)
- Sensor name
- Alert indicator
- Three-dots menu
- Up to 4 sensor values organised by selected view
- Update time
- Battery status indicator
History view (dashboard)
- Sensor graph according to selected view
- Sensor name
- Alert indicator
- Three-dots menu
- Up to 3 additional sensor values organised by selected view
- Update time
- Battery status indicator
Full sensor card
- Sensor background image
- Sensor name
- Update time
- Sensors and last measurement value
- Alert indicator in sensor boxes
- Selected sensor graph
- csv-export
- Dropdown menu for timeframe selection
- Graph
- Datapoint value
- Min/Max/Avg values for selected timeframe
- General (sensor name, owner, share, owner’s Ruuvi plan)
- Alerts (temperature, humidity, pressure, signal strength RSSI, movement, cloud connection)
- Offset correction (temperature, humidity, pressure)
- More info
- Remove
Important notice: not all our Ruuvi Sensors are equipped with the same measurement components. For example, if you have a RuuviTag Pro 2-in-1 that measures only movements and temperature, humidity and air pressure readings will remain empty and are hidden from view. Read more about the different sensors and their components here.
Every individual sensor card has multiple configurable settings, such as name, background image, ownership and sharing settings, alerts and offset correction. These are managed on the full sensor card page.
History
Sensor history is shown on the full sensor card view. You can access full sensor card from three-dot menu (dashboard views) or tap on dashboard sensor card to move to full sensor card.
Alerts
Each sensor can alert about a set limit being reached. Choose Settings & alerts from the three-dot menu (dashboard views) or tap on dashboard sensor card to open full sensor card to view and configure alert settings.
Alert indications
If any pre-configured alert gets triggered, an alert will be displayed on the sensor card to indicate this.
Subscribers that have Ruuvi Cloud Pro or higher will also receive an email notification sent to the email address associated with your Ruuvi account.