Predicting weather may seem to be difficult and require expensive equipment. Only the real meteorologist can accurately predict the weather for the upcoming days. And more often than not, these predictions are not precise. Read this article and learn how to predict weather with your own weather station DIY!
See local weather forecast for today and tomorrow if you don’t have own weather station:
How to predict tomorrow’s weather forecast with your own weather station?
Predicting weather is actually a lot easier than you might expect. Air pressure plays a huge role in determining the weather for the next 0-48 h. The link between atmospheric pressure and weather has been well-known for hundreds of years.
The problem with longer weather predictions is that it is impossible to perfectly predict air movements. And, the number of elements affecting the weather is huge. For example, they include the earth’s rotation and the moon’s position. That is why a few days’ prediction is usually correct but anything longer than that might be inaccurate.
In this article I will be talking about:
- The basics of air pressure
- How it affects the weather
- Tips to monitoring it
- How to predict upcoming weather all by yourself
But without further ado, let’s head straight into discussing air pressure!

What really is air pressure?
Our atmosphere consists of different gases. Basically, there is 78% nitrogen and 21% of oxygen in our air. The remaining 1% consists of carbon dioxide, water vapour and other gases. Even though they are invisible to us, they have mass and hence they have their weight. Earth’s own mass pulls all the molecules towards the surfaces, which causes a force to be applied on the surface. In other words, on the surface of the earth, tons of molecules are bearing down on you, creating pressure.
At sea level, the pressure is basically at its highest. And at high altitudes, for example plains or high mountain ranges, the pressure is lower. You notice this decrease in pressure in a plane. As the plane is ascending or descending, the pressure level is changing. This causes differences between the inner part and the outer part of the ear. This difference in pressure creates a force inside your ear, which can cause pain.
Hectopascal (hPa) is the most commonly used unit to measure air pressure. The scientific average of air pressure is 1013 hPa. And the average range is between 980 hPa and 1030 hPa.
What does high and low air pressure mean?
High and low pressure are relative subjects. Air pressures differ greatly in different places. This is why you need a longer time to examine atmospheric pressure and its changes. The key is to find the typical range of pressure values and compare them.
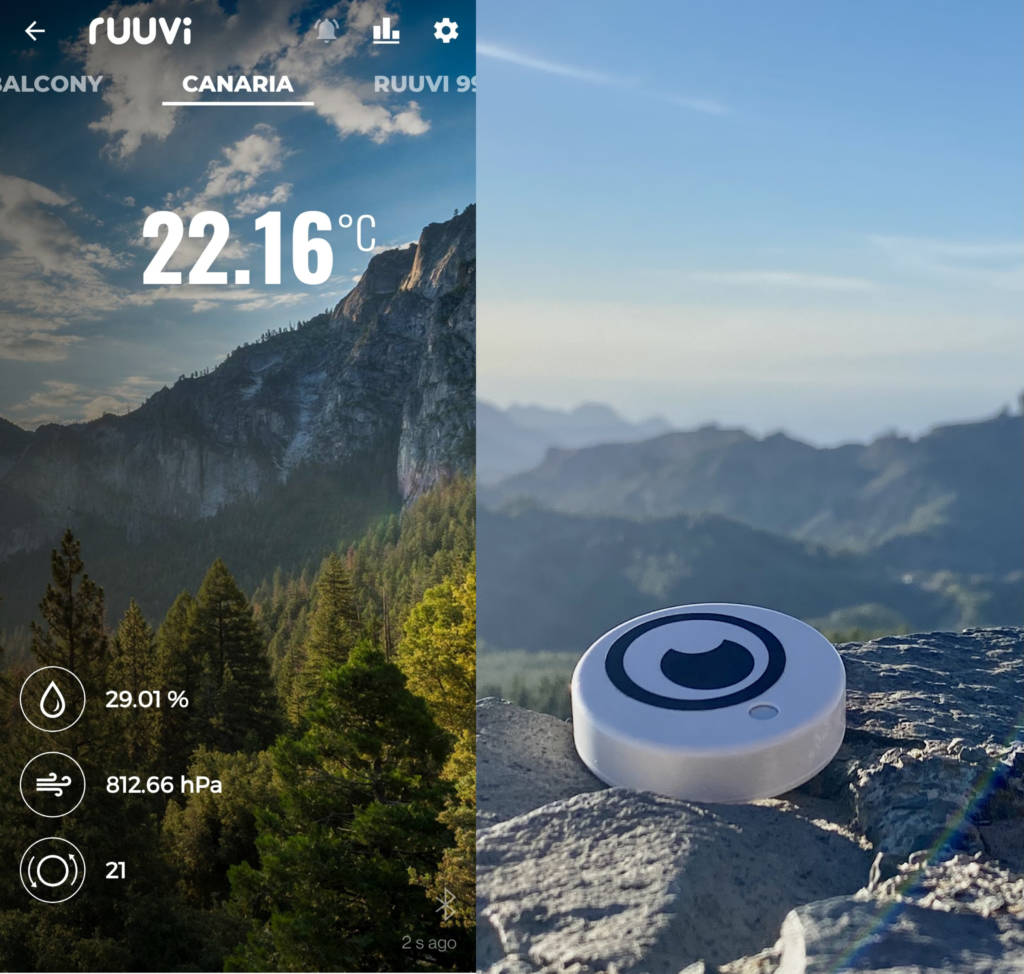
For example, in high mountain villages, you may have the average air pressure around 810 hPa. At sea level, the same pressure level would cause a horrific tropical storm! But more on this later.
Now that we understand the basics of air pressure, we can move to applying this knowledge to weather forecasts.
How does weather affect air pressure?
Weather changes constantly. And so does air pressure. In general, factors changing the air pressure are uncontrollable. The earth’s rotation, placement of the sun, winds and different natural phenomena make the air move. And as more air is packed into a small location, atmospheric pressure increases.
How does high air pressure affect the weather?
High pressure will indicate clear skies and either relatively high or low temperatures.
In high pressure areas, air is pushed closer to the surface. As air descends, it warms as temperature on the surface is higher than in the upper atmosphere. This warm air will prevent clouds from forming and hence result in a clear sky.
If a high pressure zone is coming from the north, it brings cooler air to the surface. If it comes from the south, it will bring warmer air to the surface. This is why in a high pressure zone, it is usually warmer during summers and cooler during winters.
How does low pressure affect the weather?
Low pressure zones are cloudy, usually rainy and temperature will be in the average range for that area.
Air tends to rise in a low pressure zone. Therefore, in lower pressure zones air will ascend which causes it to cool down. Air rises because there is less air on top of it than in higher pressure zones. When something cools down, its capacity to hold moisture shrinks. The same happens to air and it will start to condense and form precipitation. The clouds form from this occurrence and once filled with enough moisture, it will eventually be released as rain.
In low pressure zones, as the air is rising, winds will blow new air to fill this void. That is why in low pressure areas there is usually more wind than in high pressure areas.
What are the best tools for your own weather station?
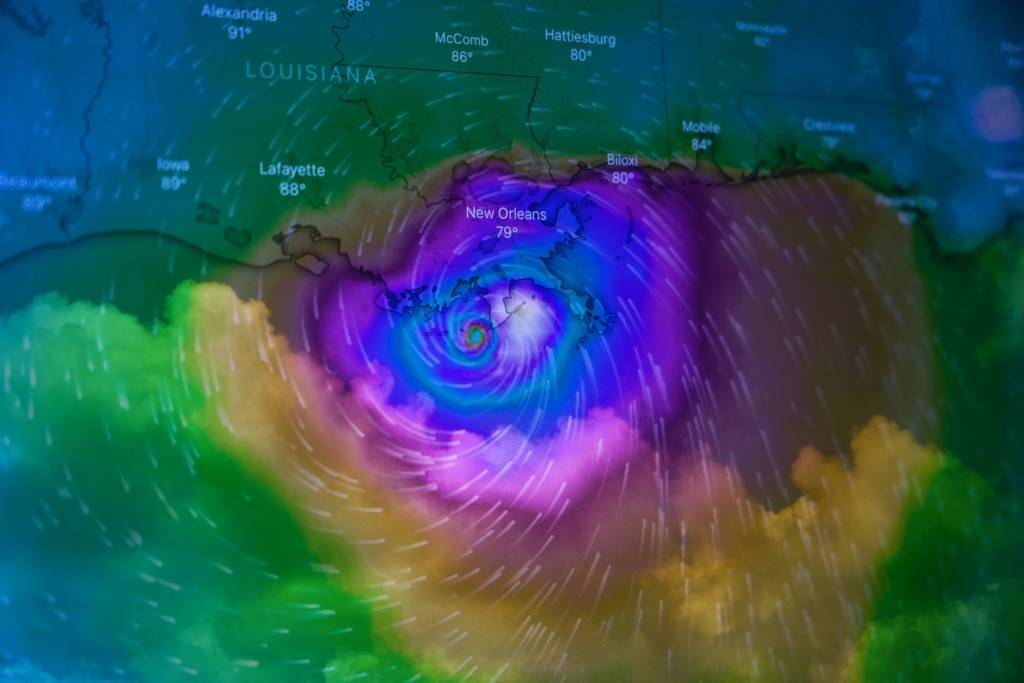
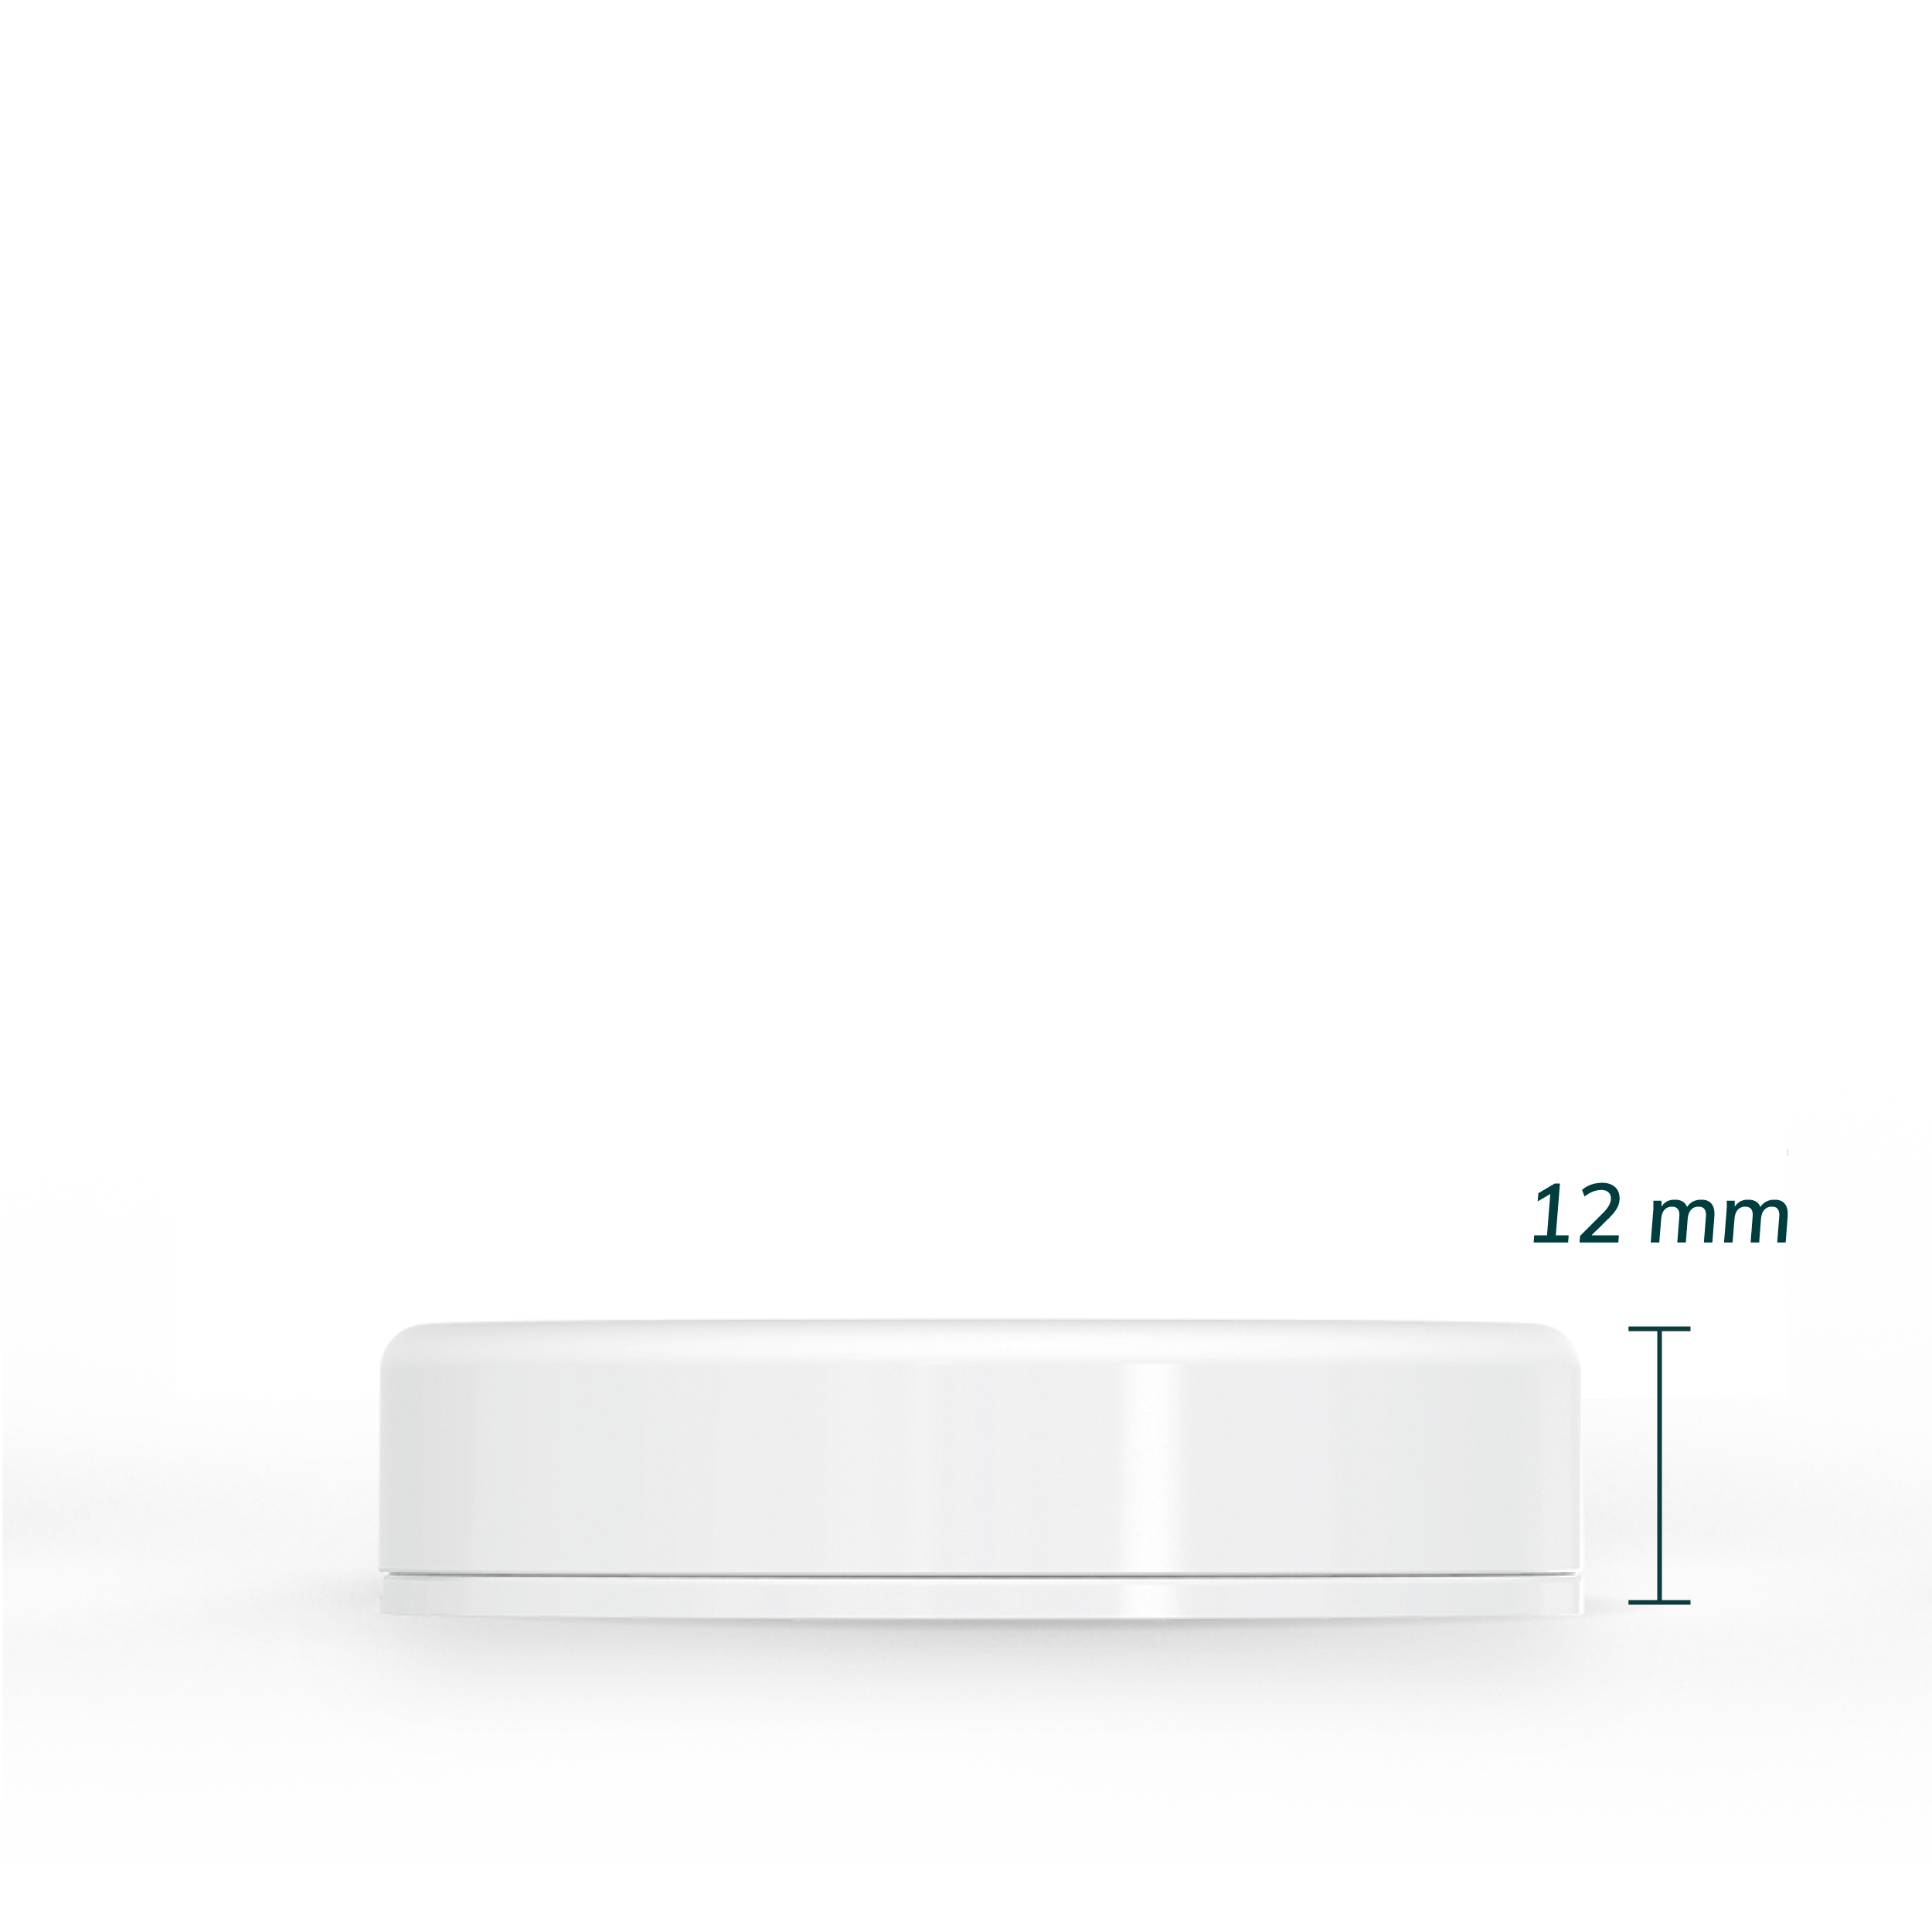
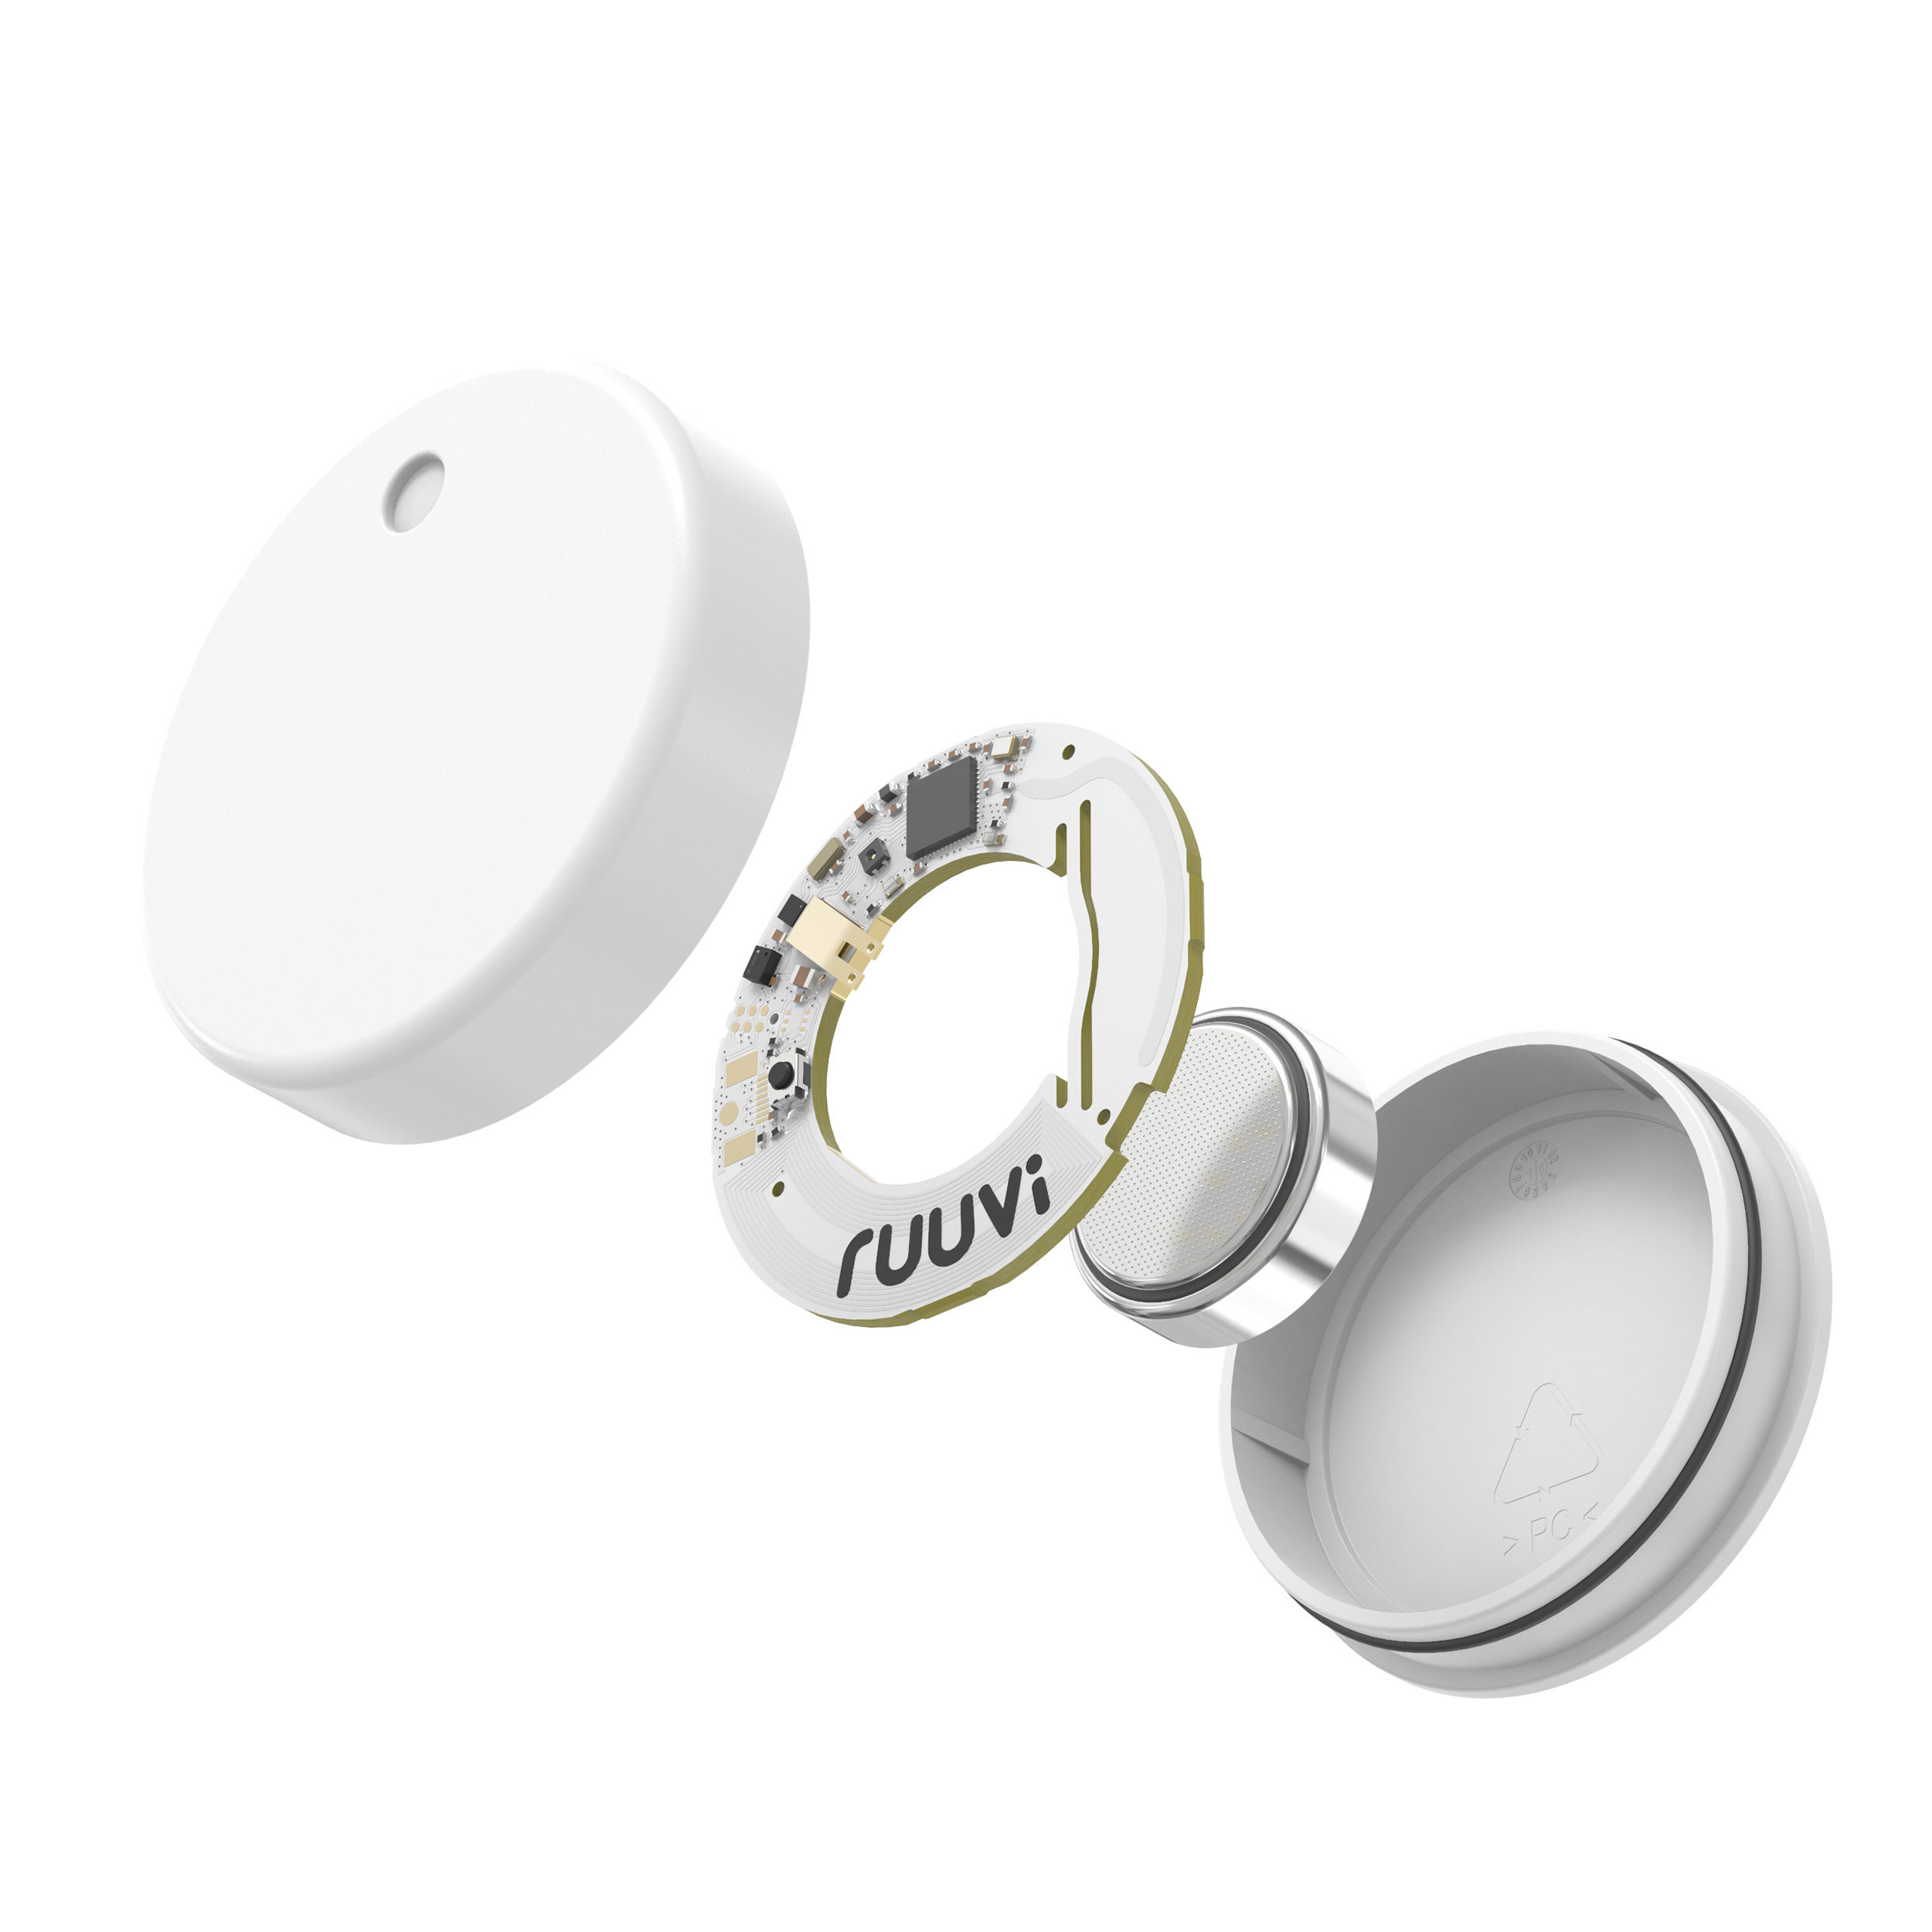
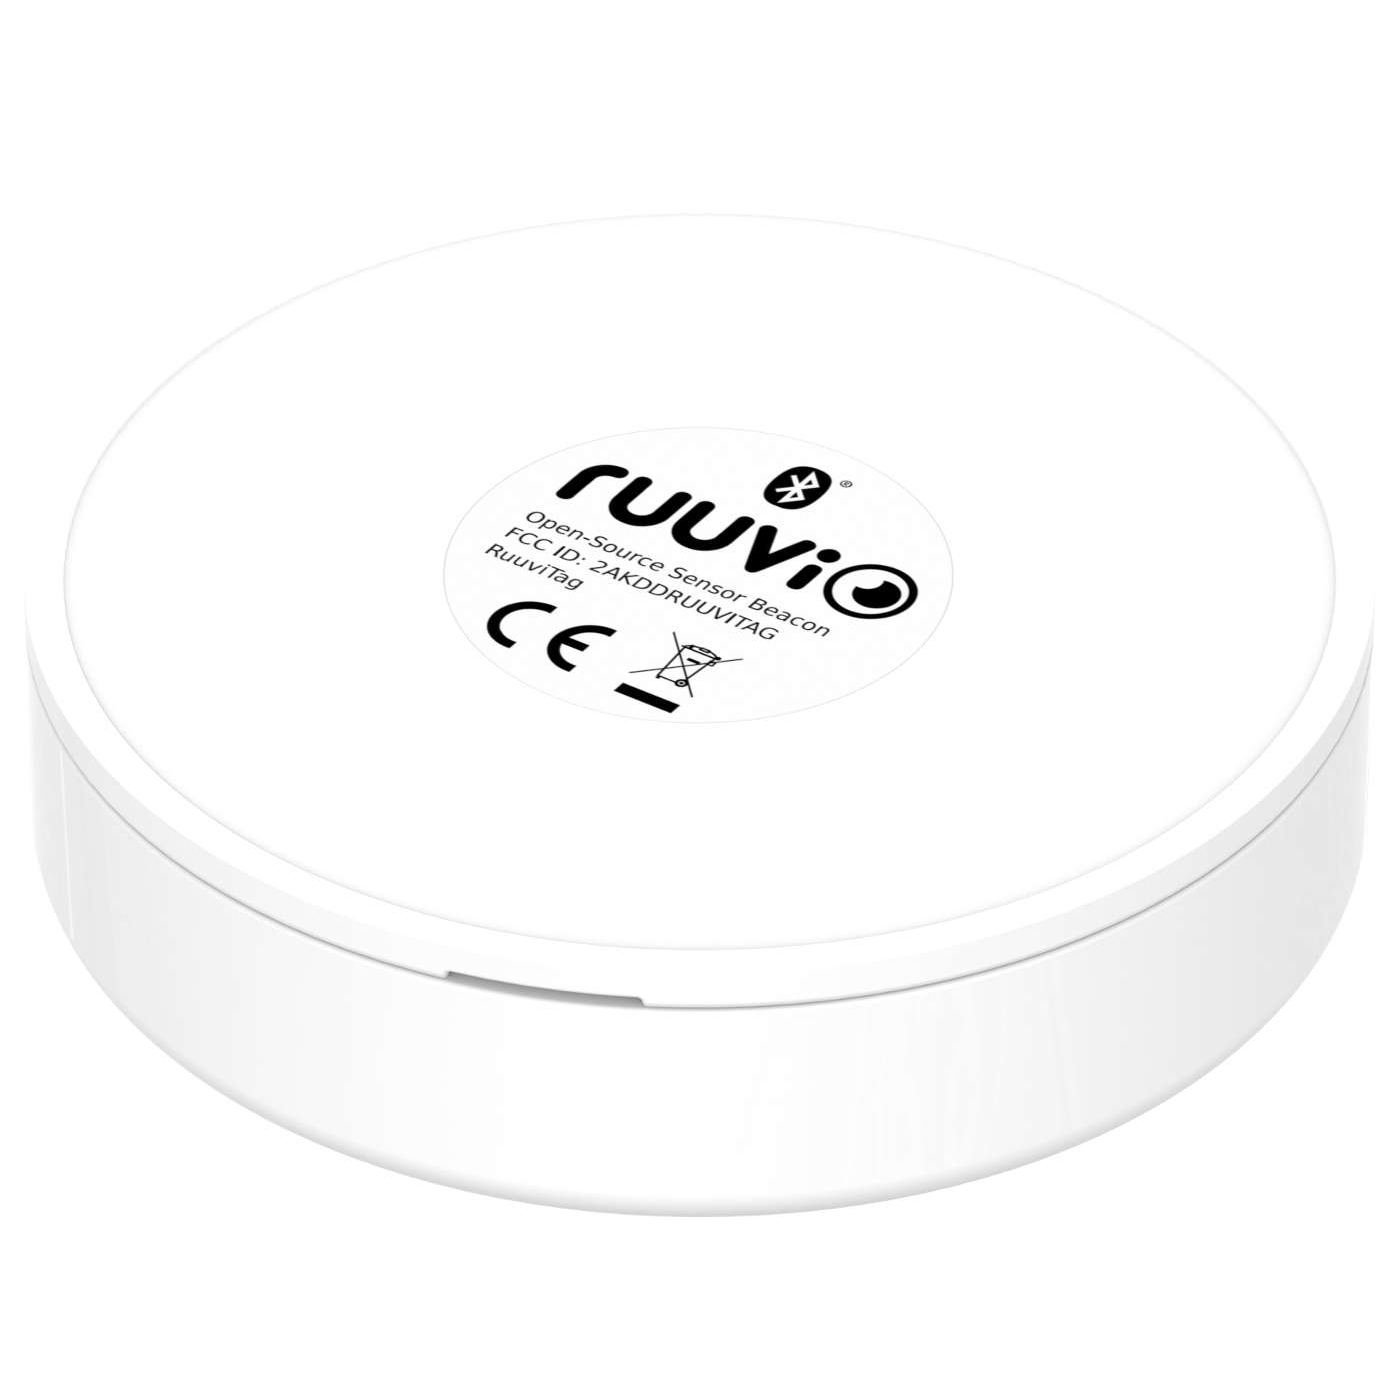
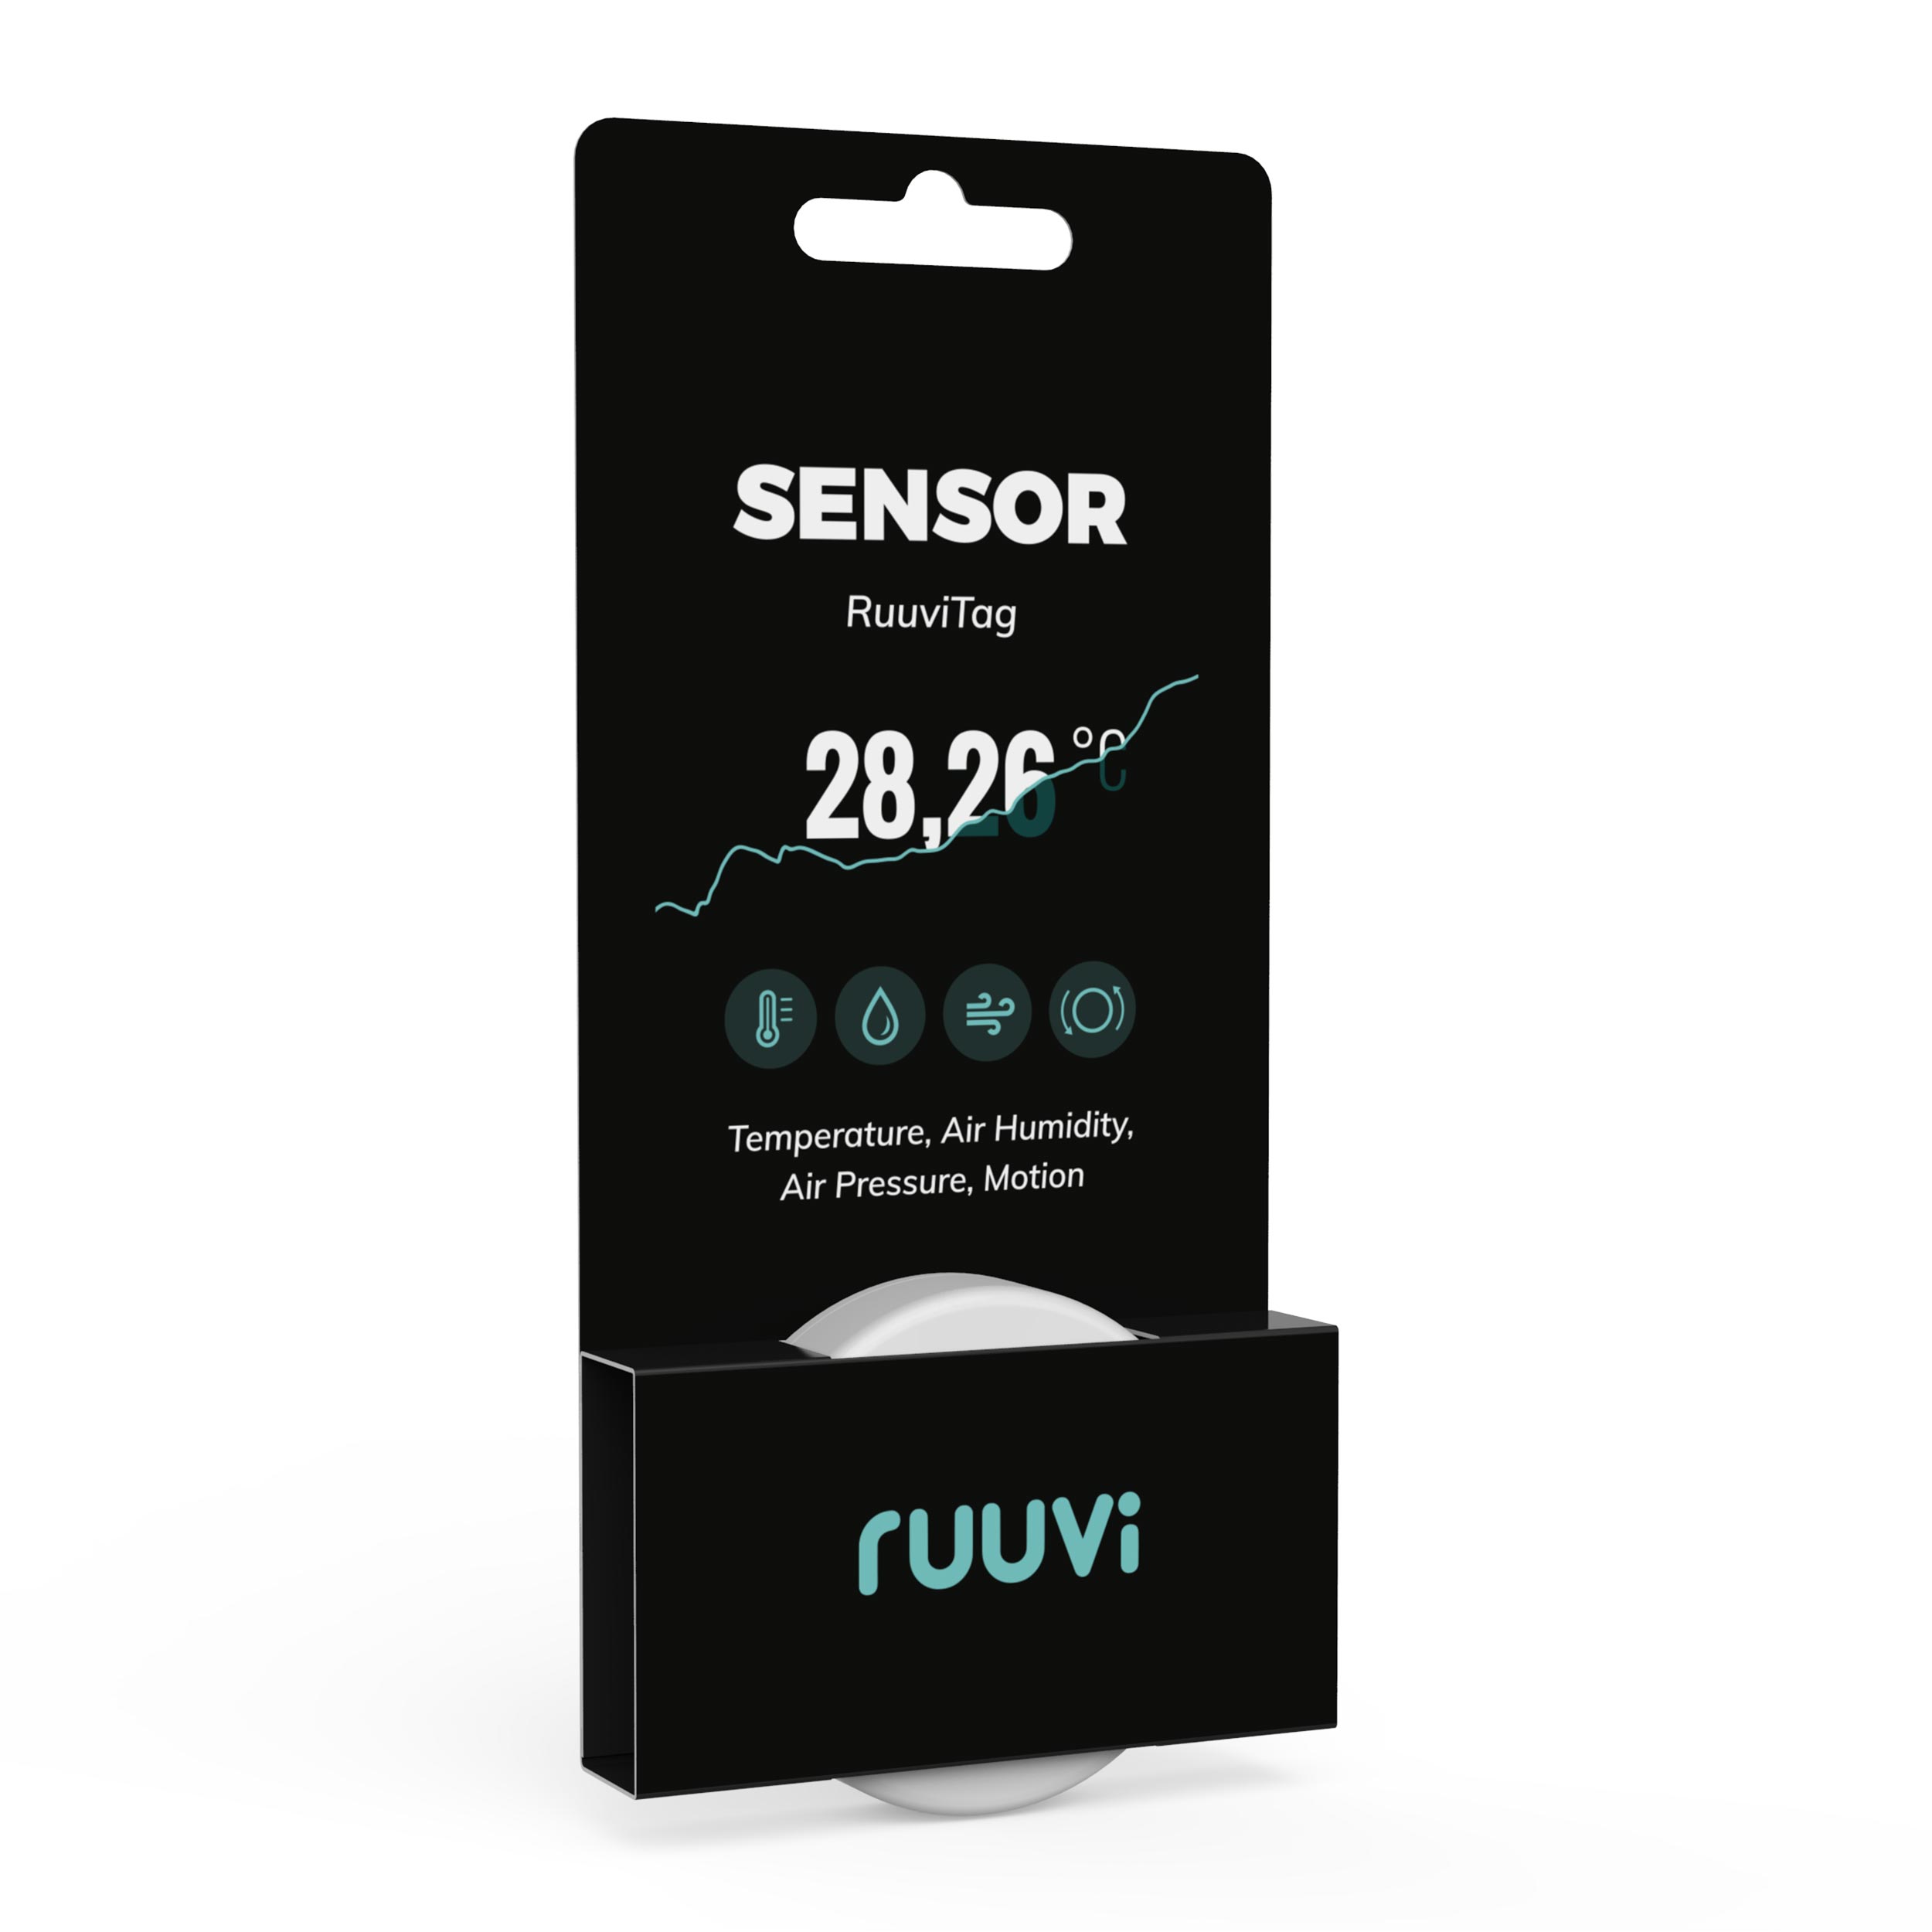
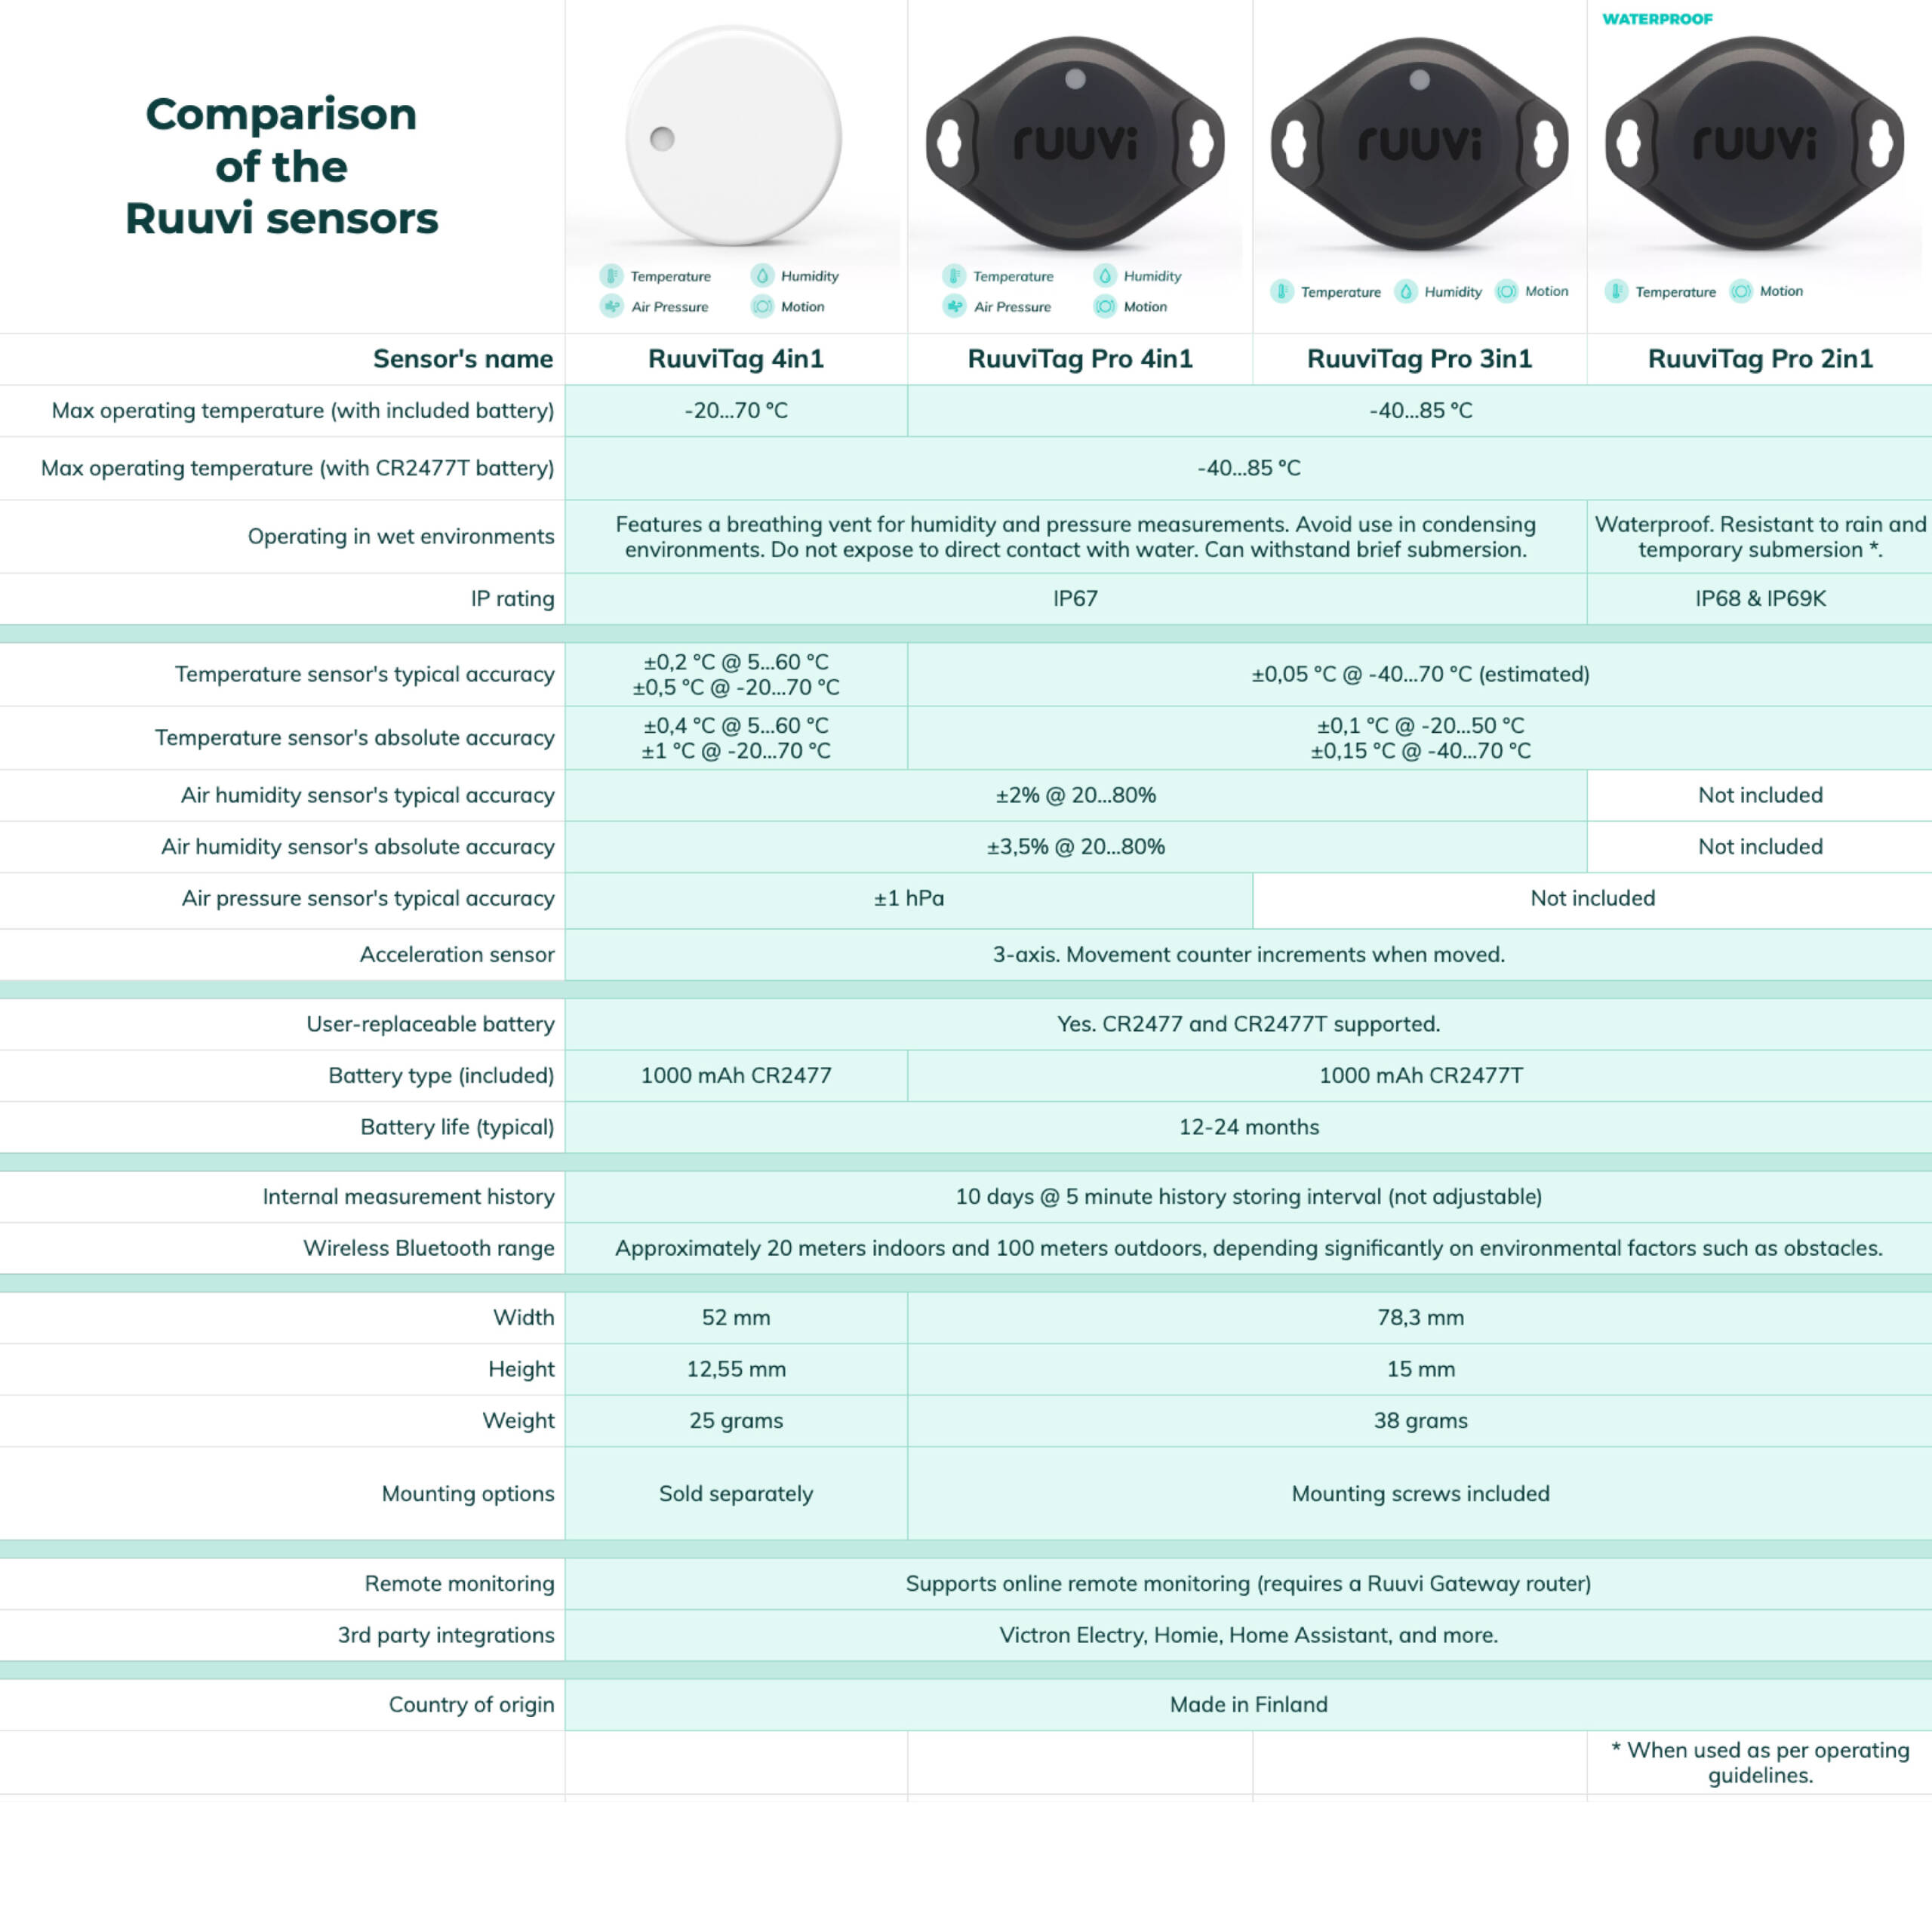
Barometers are used to determine the changes in air pressure. They come in all shapes and sizes, but they all measure air pressure. Best option for a DIY-weather station is a RuuviTag sensor.
As the changes in air pressure are miniscule, you must take readings almost constantly. That is why it is convenient to have a device that can continuously draw a graph of the readings. Being able to set notifications to alert you when a larger difference occurs is also useful.
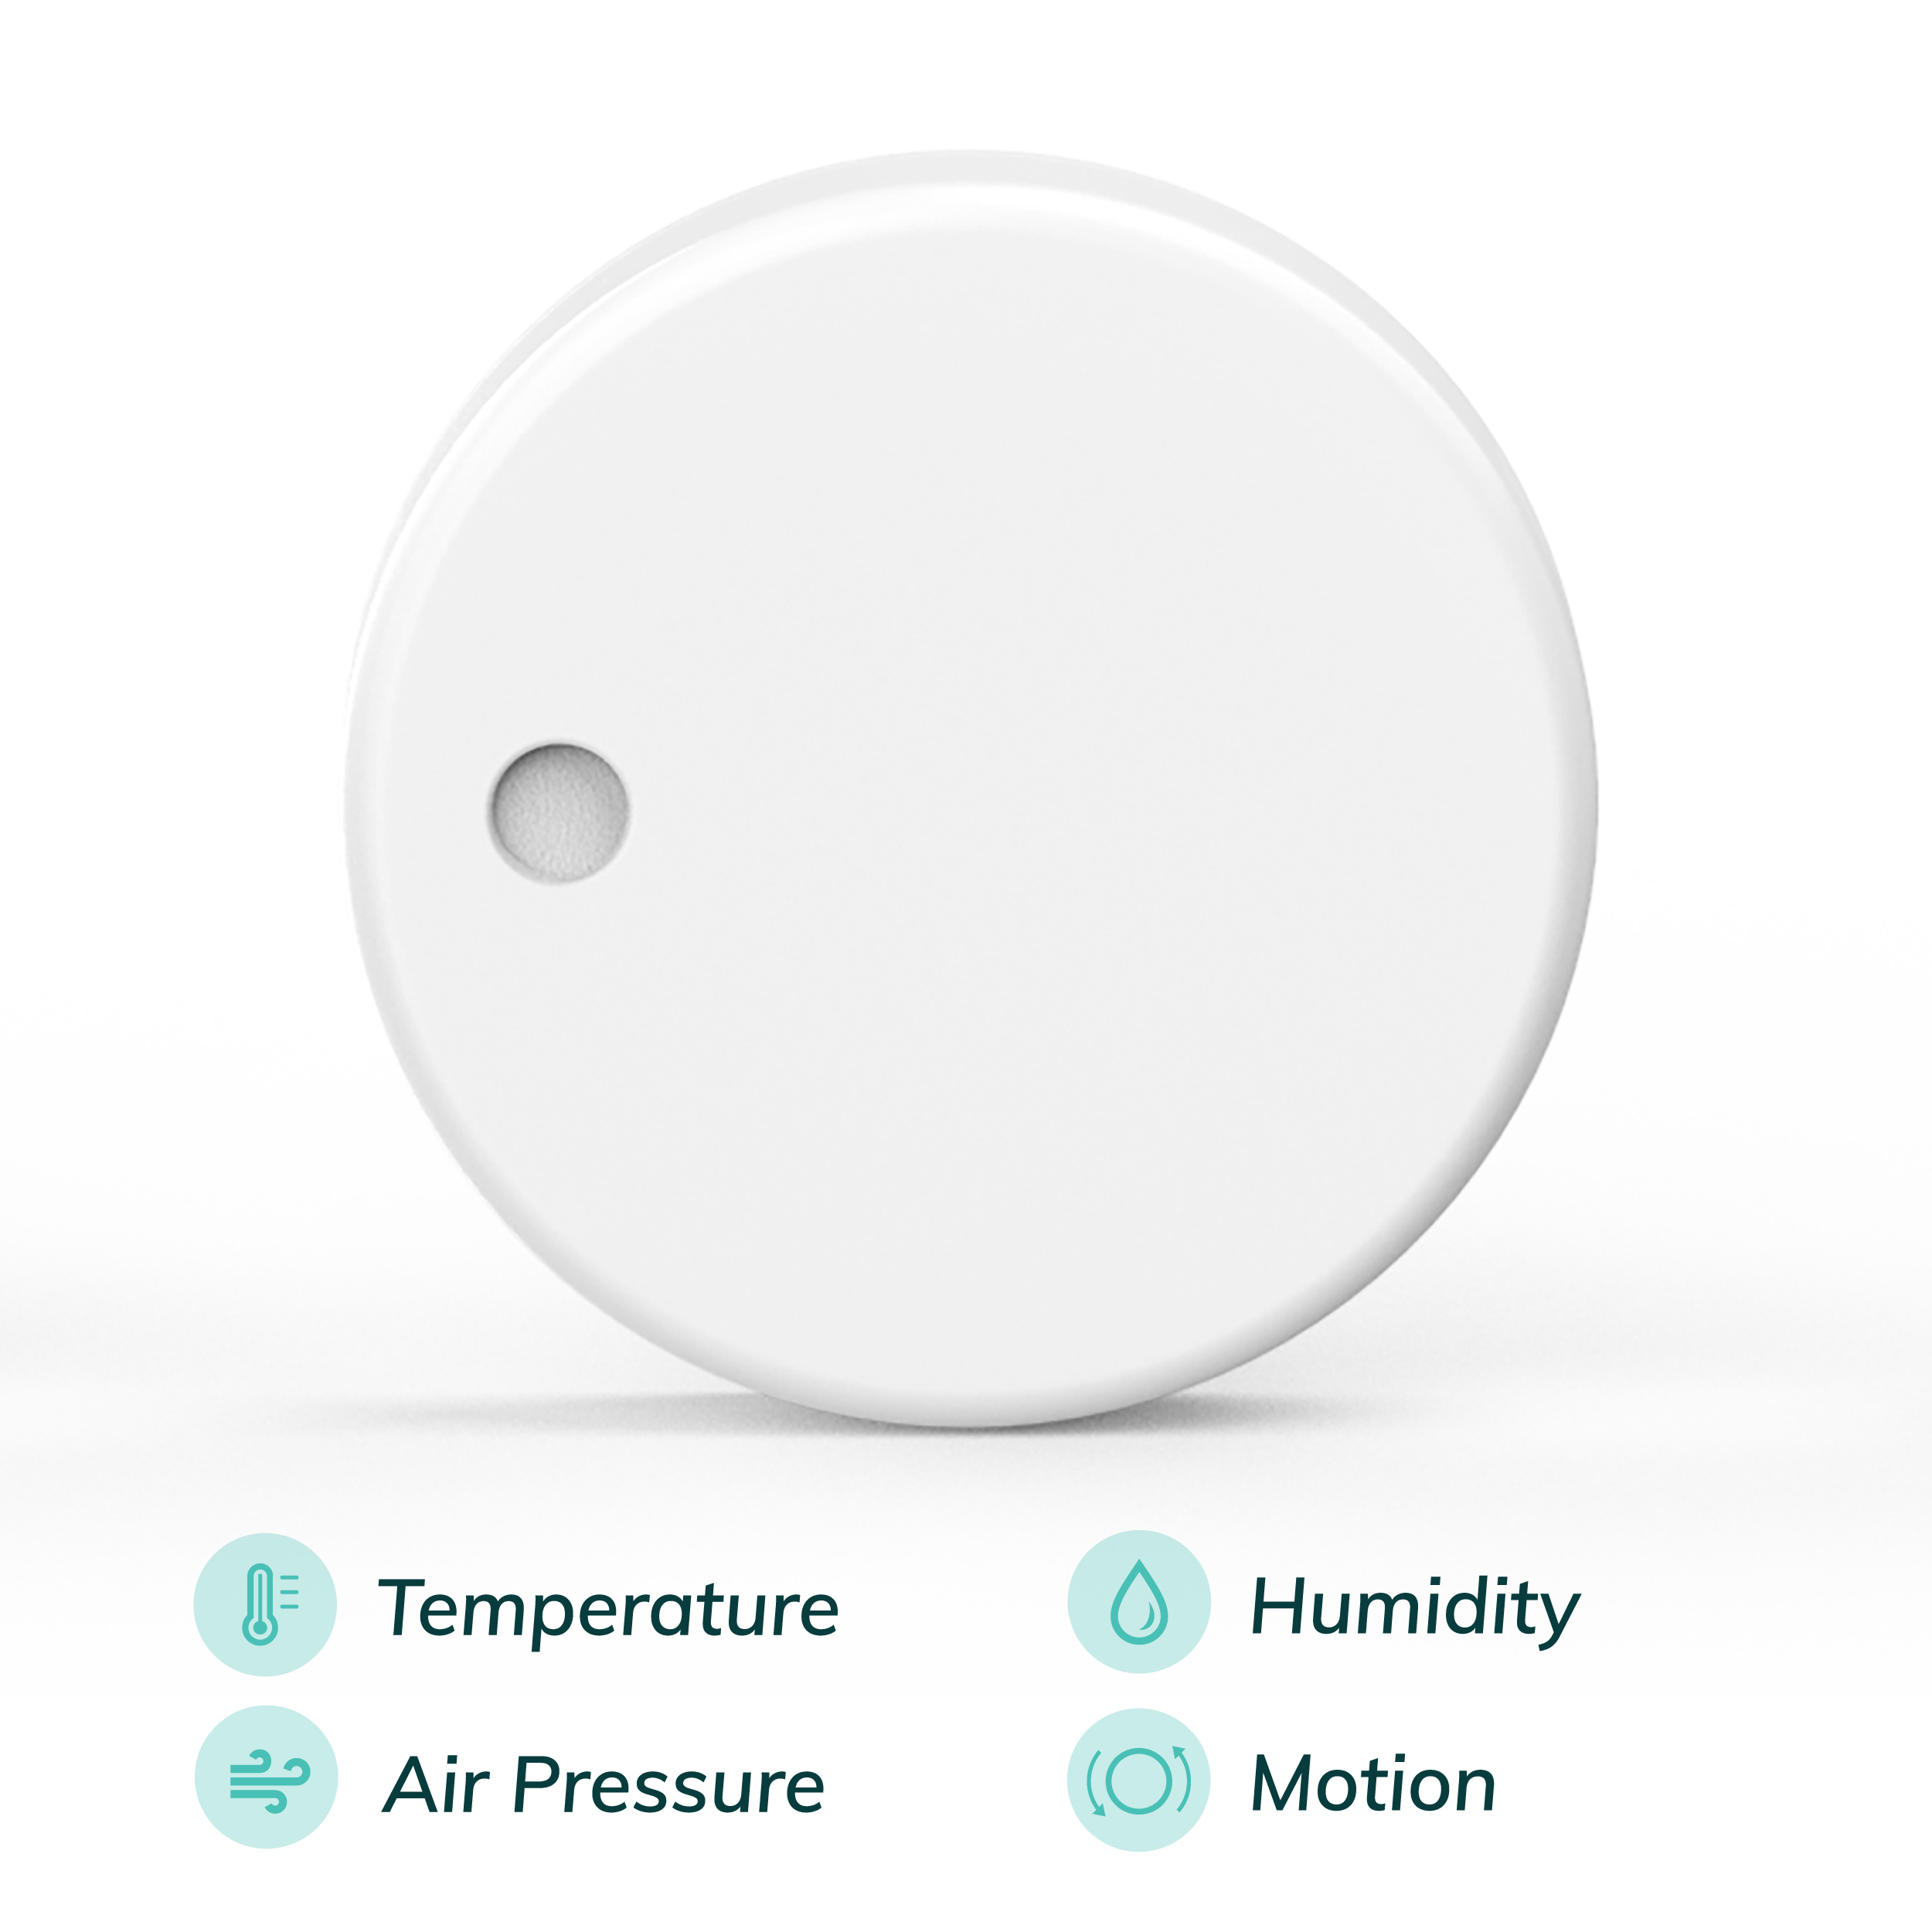
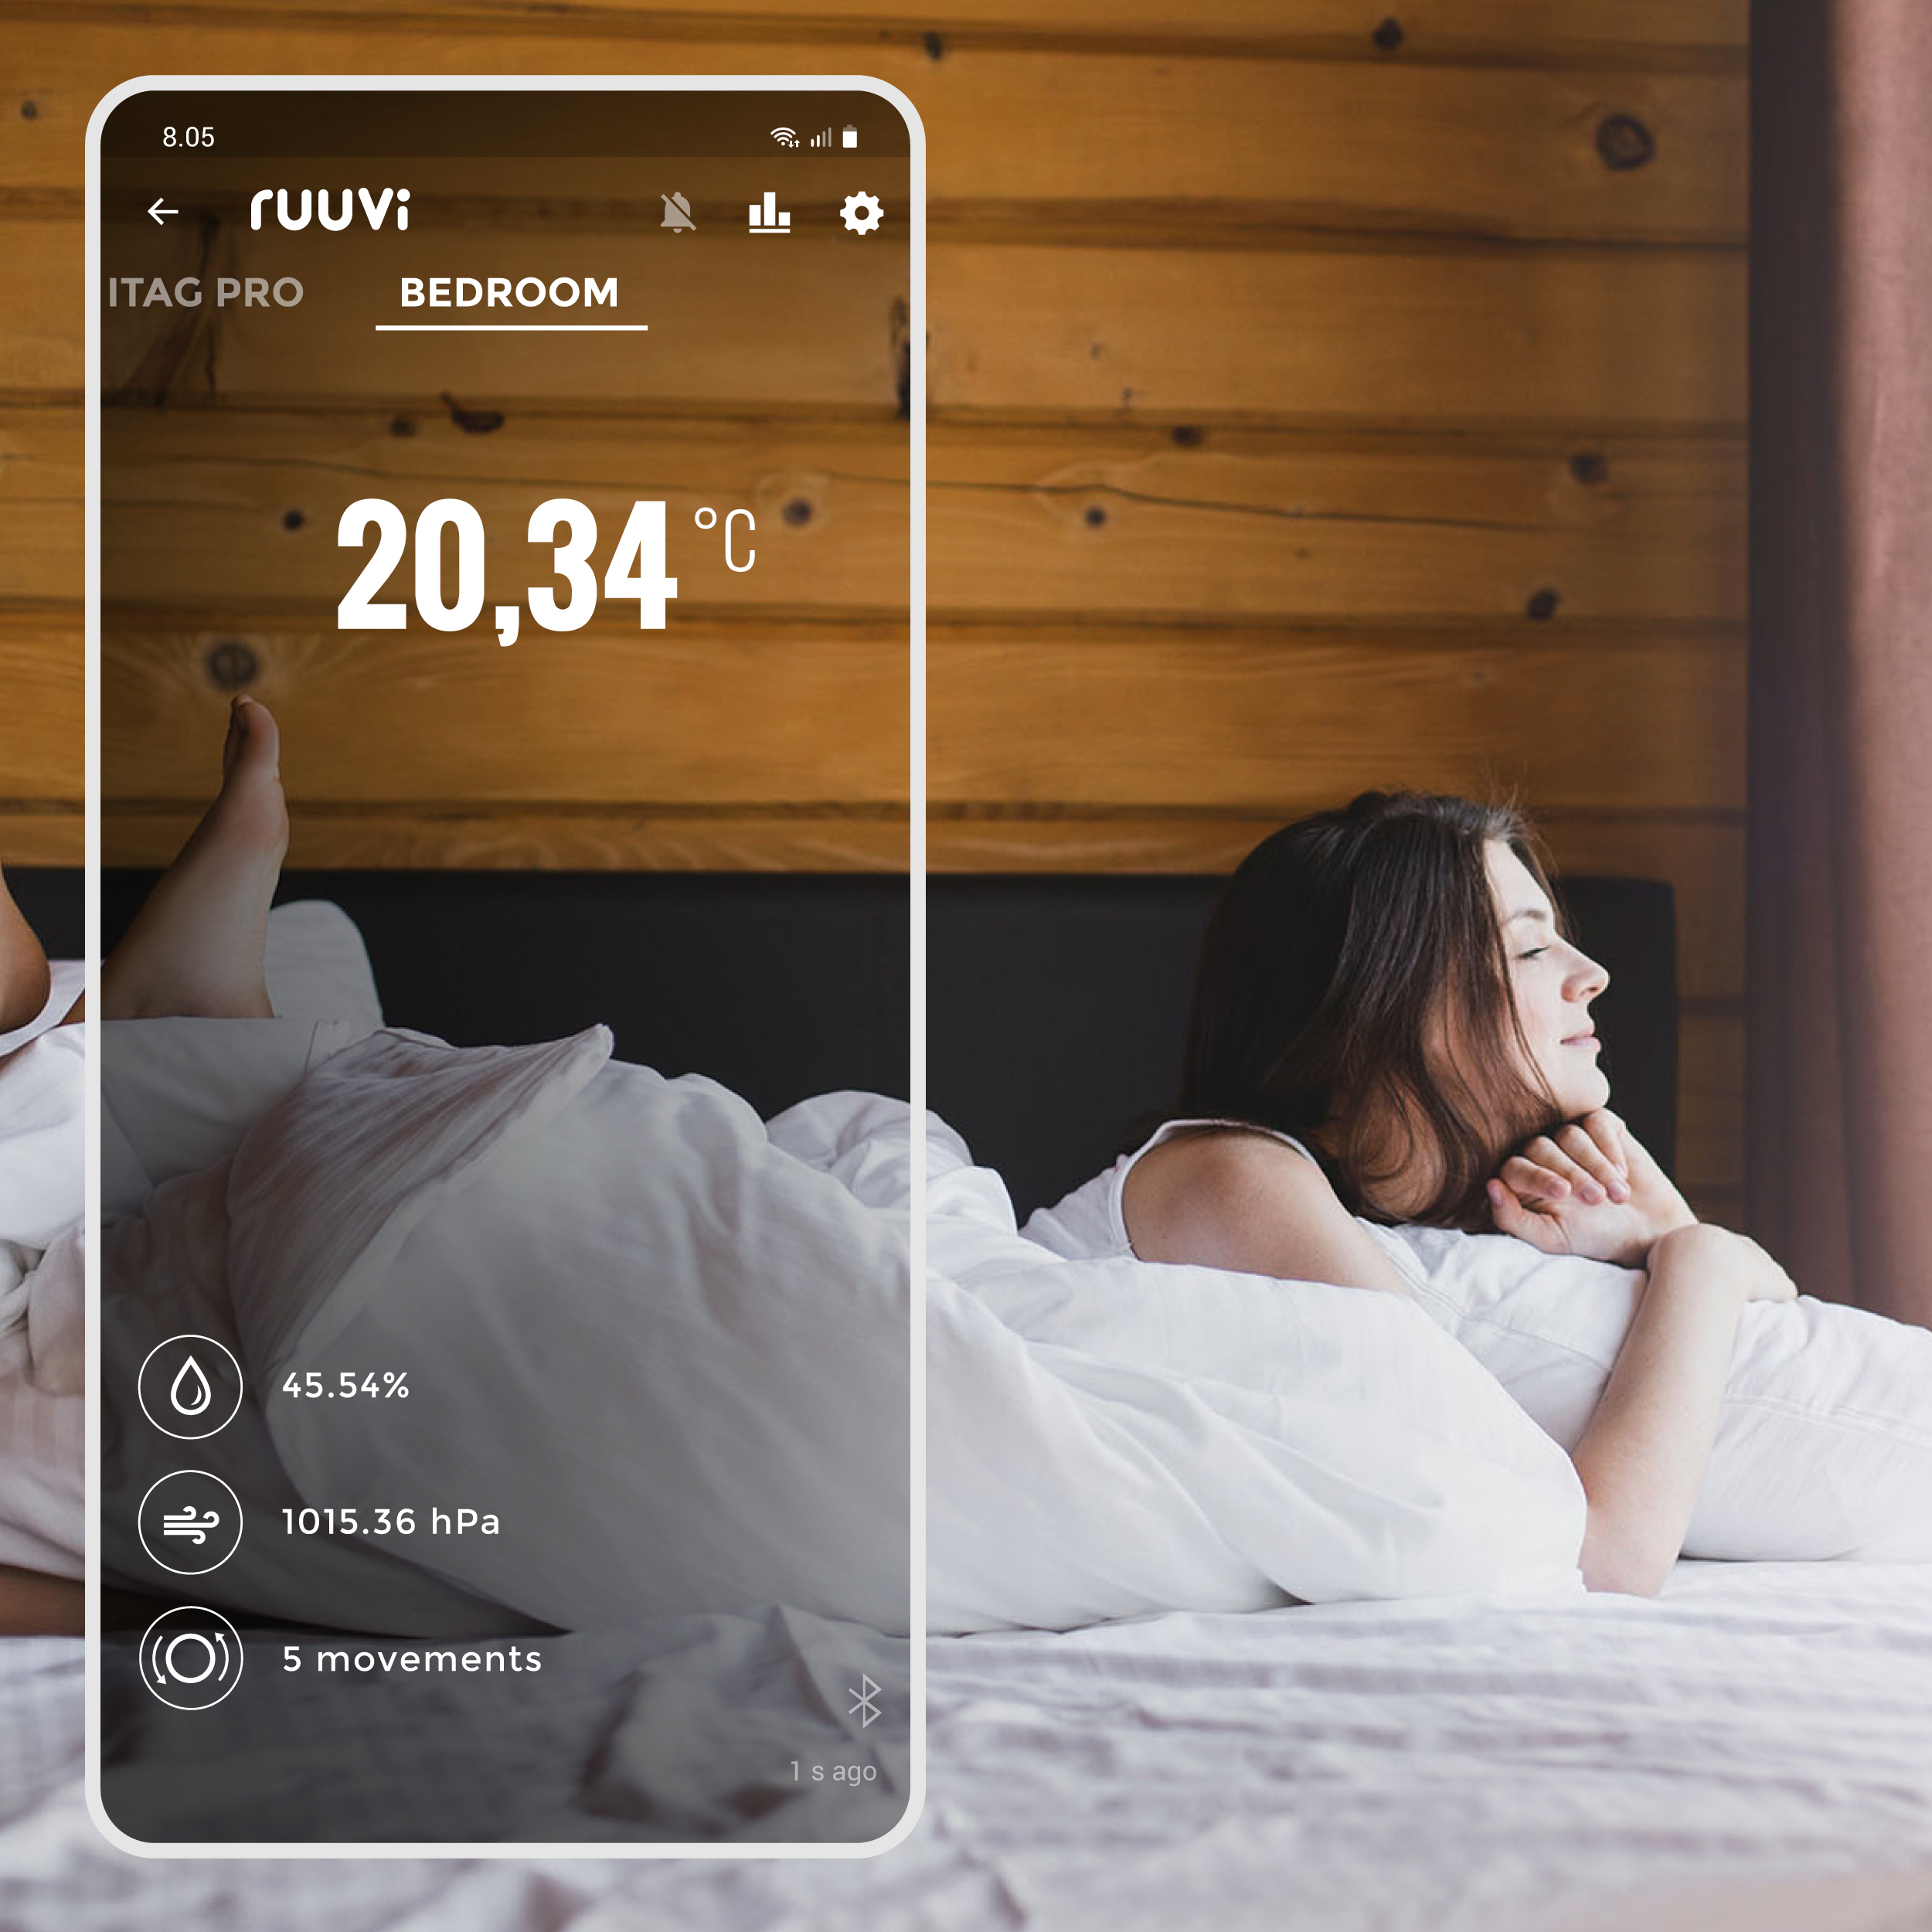
RuuviTag works on a mobile application and it can measure environmental factors in all weather conditions. It also measures humidity and temperature, giving you all the information you need to become a meteorologist! Take a look at further specifications Here.
Now that we know how pressure works, and how we can measure its changes, we can start to learn to become weather forecasters!
Preparing your weather station to predict weather
We start by setting up our weather station outside. Ruuvi is a great option, but anything with a working barometer will do the trick. Before we can start predicting the weather, we have to find the basic values of our local climate. This process will take a week or two. With longer experiment times, you will start to make more accurate predictions as you gain more data.
Building your own weather station is not complicated by any means. Building an affordable weatherhub using Ruuvi’s products gives you valuable insight into the weather. You may also opt to spend more money to get a weather station with an anemometer in the same package or perhaps consider selecting a Netamo weather station, as it does the forecasting for you.
Ruuvi Sensors work wirelessly with Bluetooth sending the weather data directly to your mobile phone. But, as the weather station is best used outside, you might find it convenient to acquire a WiFi weather station to send the data straight to the Cloud. No pun intended. Ruuvi Gateway is a device engineered to do so. It connects with Ruuvi Sensors and transfers their data straight to the Internet. Hence, you may access your own weather information at all times.
Building your own wireless weather station is also an option. With a bit of understanding of electronics, you can build a totally wireless weather station with RuuviTag by using Rasberry pi or Arduino. As Ruuvi products are open-source based, integrating them into these platforms is easy. Read the complete instructions to build your own Rasberry pi weather station on our blog here!
What to do with your weather station?
I started to gather data on a spreadsheet to help me keep track of different variables such as air pressure and wind. I took a week’s worth of data to really examine the effects of pressure change. As well as, I followed the temperature and air humidity. As I live in a city centre, I do not have access to a self-made anemometer (a wind detector), so I took these measurements from the Internet.
The key is to look for changes in the atmospheric pressure. The basic principles are as follows:
- If the pressure is rising, the weather tends to clear up
- Big white clouds are found up in the atmosphere, wind starts to weaken, temperature fluctuates
- If the pressure drops, the weather is going to get cloudy
- Sky is covered with grey clouds closer to the surface, wind is picking up and chances of rain rise
- If atmospheric pressure drops to an irregularly low level, a storm is on the way
- On the other hand, if the pressure rises to an irregularly high level, extreme temperatures are coming
How does wind affect the weather
The Northern wind brought a very low temperature to where I live. Combined with high pressure the prediction was rather easy. As I live on the coast of Finland, winds coming from the Baltic sea usually bring rain and clouds. This is also seen in the data shown below.
Results
Here is the spreadsheet I made during the week.
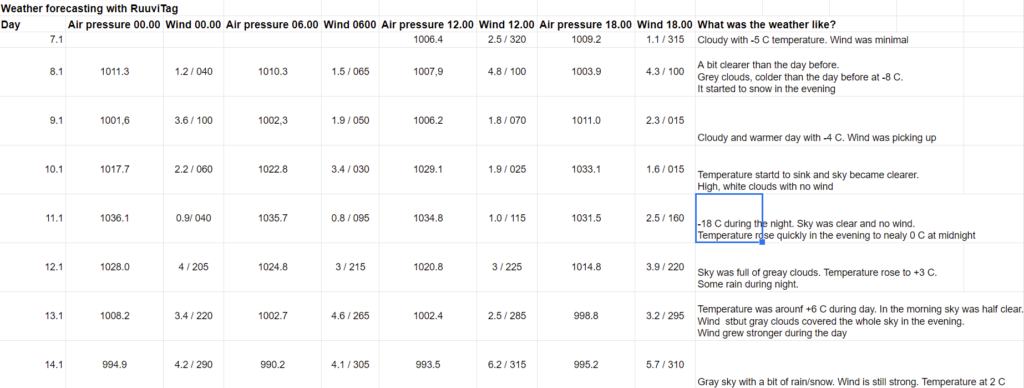
A week was a very short period of time to try to figure out the rules in the weather. But even in that time, I was able to find common characteristics that determine the weather.
You can see the rapid rise of air pressure during 9th and 10th of January. Then, the weather became clear and we experienced this year’s coldest night! At that time, air was moving in from the north, which caused the cold air to be forced into the local weather system.
You might notice that when the atmospheric pressure dropped down, the wind always grew stronger. Retrospectively, you can easily notice these differences in air pressure before they affect the weather.
Here is a screenshot from Ruuvi station, the application that displays Ruuvi Sensors’ data from the same time period.
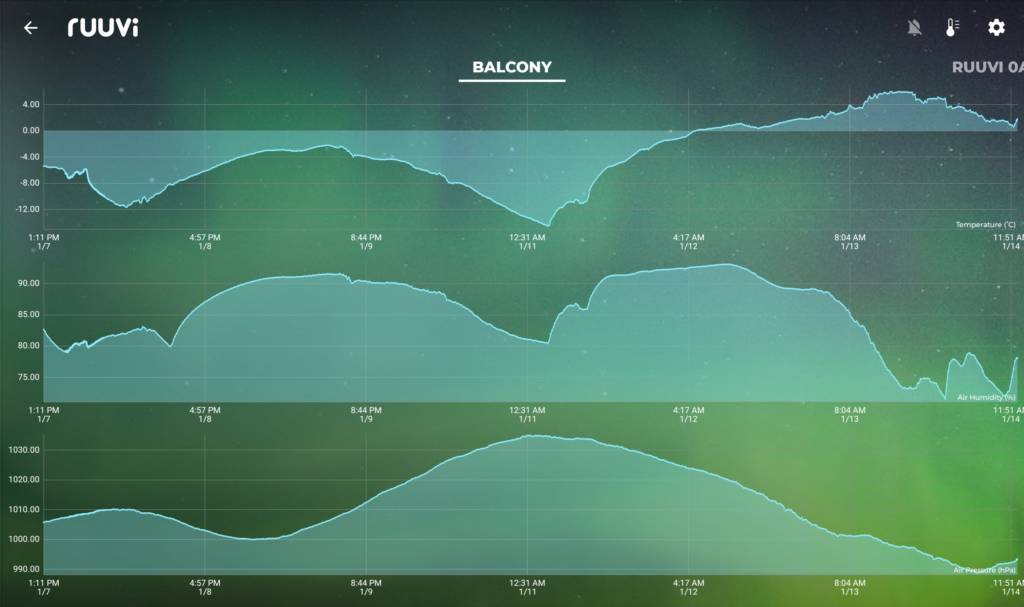
Here you can see how well the temperature (the top chart) is associated with air pressure (the bottom chart). The middle chart displays air humidity, which correlates mainly with temperature. Humidity is now shown as relative humidity. Therefore, the rise in temperature reduces relative humidity. Feel free to learn more about this from our other blog post! You can access it here!
Also, my measurements are made in north Europe. For context, here is a website that represents typical weather conditions and how to predict them in the United States. Take a look at this article.
Inch of mercury (inMg) is the unit used in the US.
- 30,2 inMg ≈ 1021,7 hPa
- 30 inMg ≈ 1015,9 hPa
- 29,8 inMg ≈ 1009,2 hPa
Other methods to predict weather
Using a barometer is the most analytical way of determining weather. Other ways of predicting include, for example, analysing cloud shapes. Analysing clouds is more difficult than predicting weather from atmospheric pressure readings. It also accurately predicts a rather short period of time.
Other forms of weather prediction include examining different flowers’ behaviour and differences in sunsets and sunrises. But, I suggest you choose a barometer over these latter options…
Summary for weather prediction
Predicting short-term weather is 100% possible with the right instruments. Simply acquire a barometer, or in this case, an all inclusive air pressure detector to start your weather predicting career. High pressure is usually regarded as causing good weather. And low pressure is considered to cause bad weather. But, keep in mind that the most important thing is the difference between air pressure levels! Every climate is different and unique, with different average air pressure levels. So, go out there with this basic knowledge and there is nothing stopping you from becoming a weather forecaster!
I know that at least I am going to keep on tracking the differences in atmospheric pressure to predict weather on the go. With RuuviTag it is easy and convenient. It will be especially useful in the summer when I sail a lot. I consider having the ability to predict upcoming weather on the boat as a personal superpower!
RuuviTag your own simple weather station
RuuviTag is an affordable yet accurate way of predicting upcoming weather. Get your own smart sensor and become an independent weather forecaster in no time!
39,90€
Ruuvi is based in Finland. If you’re an EU consumer, VAT is included. If you’re a non-EU customer, you don't pay VAT. If you're an EU business, insert your VAT ID at checkout.
In stock
RuuviTag Sensor (4in1)
| 5 star | 90% | |
| 4 star | 10% | |
| 3 star | 0% | |
| 2 star | 0% | |
| 1 star | 0% |
Customer Images
RuuviTag Sensor (4in1)
| Quantity | Unit Price(€) |
|---|---|
| 1 | 39,90 |
| 2 | 37,40 |
| 3-5 | 36,90 |
| 6-8 | 35,90 |
| 9-12 | 34,90 |
| 13-25 | 33,90 |
| 26-99 | 32,90 |
Are you looking for bigger quantities? Contact us for pricing.
FAQ
Can I predict tomorrow's weather with a weather station?
Predicting tomorrow’s weather is possible with a weather station. Air pressure changes can tell how weather can change in the next 0-48 hours. When air pressure is changing fast it can tell about the upcoming storm. However, it’s important to note that weather prediction is not 100% accurate, and unexpected changes in weather patterns can occur.
How can I predict the weather?
You can predict the weather by following atmospheric pressure and wind measures. These values indicate upcoming weather.
Does high pressure indicate good weather?
Usually high atmospheric pressure indicates good weather as clouds are not able to form under higher pressures.
What is a barometer?
Barometer is an instrument which measures atmospheric pressure.
How does pressure affect the weather?
In low pressure areas, clouds are forming which usually leads to rain. In high pressure zones, the sky is usually clear.

Fantastic product works great with Victron Cerbo Gx!
Immediate connectivity via Bluetooth and able to see how my palms are doing in their heated winter polycarbonate boxes temperature.
Love the RuuviTag sensors!!!
We mainly measure remotely the temperature (rantasauna, grandchildren ‘s bedroom…). Works like junan vessa.