Made in Europe, Finland.
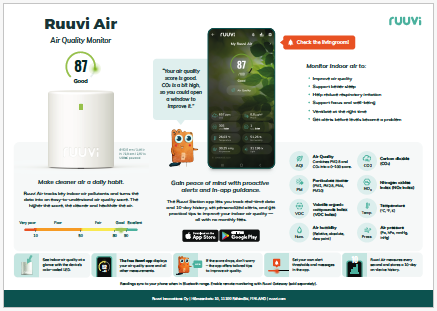
Make Cleaner Air a Daily Habit
Despite its importance to wellbeing, air quality is often overlooked. While we monitor sleep and stress with smart devices, the air we breathe indoors tends to go unnoticed – even though it can directly impact our energy, mood, sleep, and focus.
With Ruuvi Air and Ruuvi’s intuitive app, you’ll gain a better understanding of how daily life shapes your indoor environment – and how small actions can make a big difference.
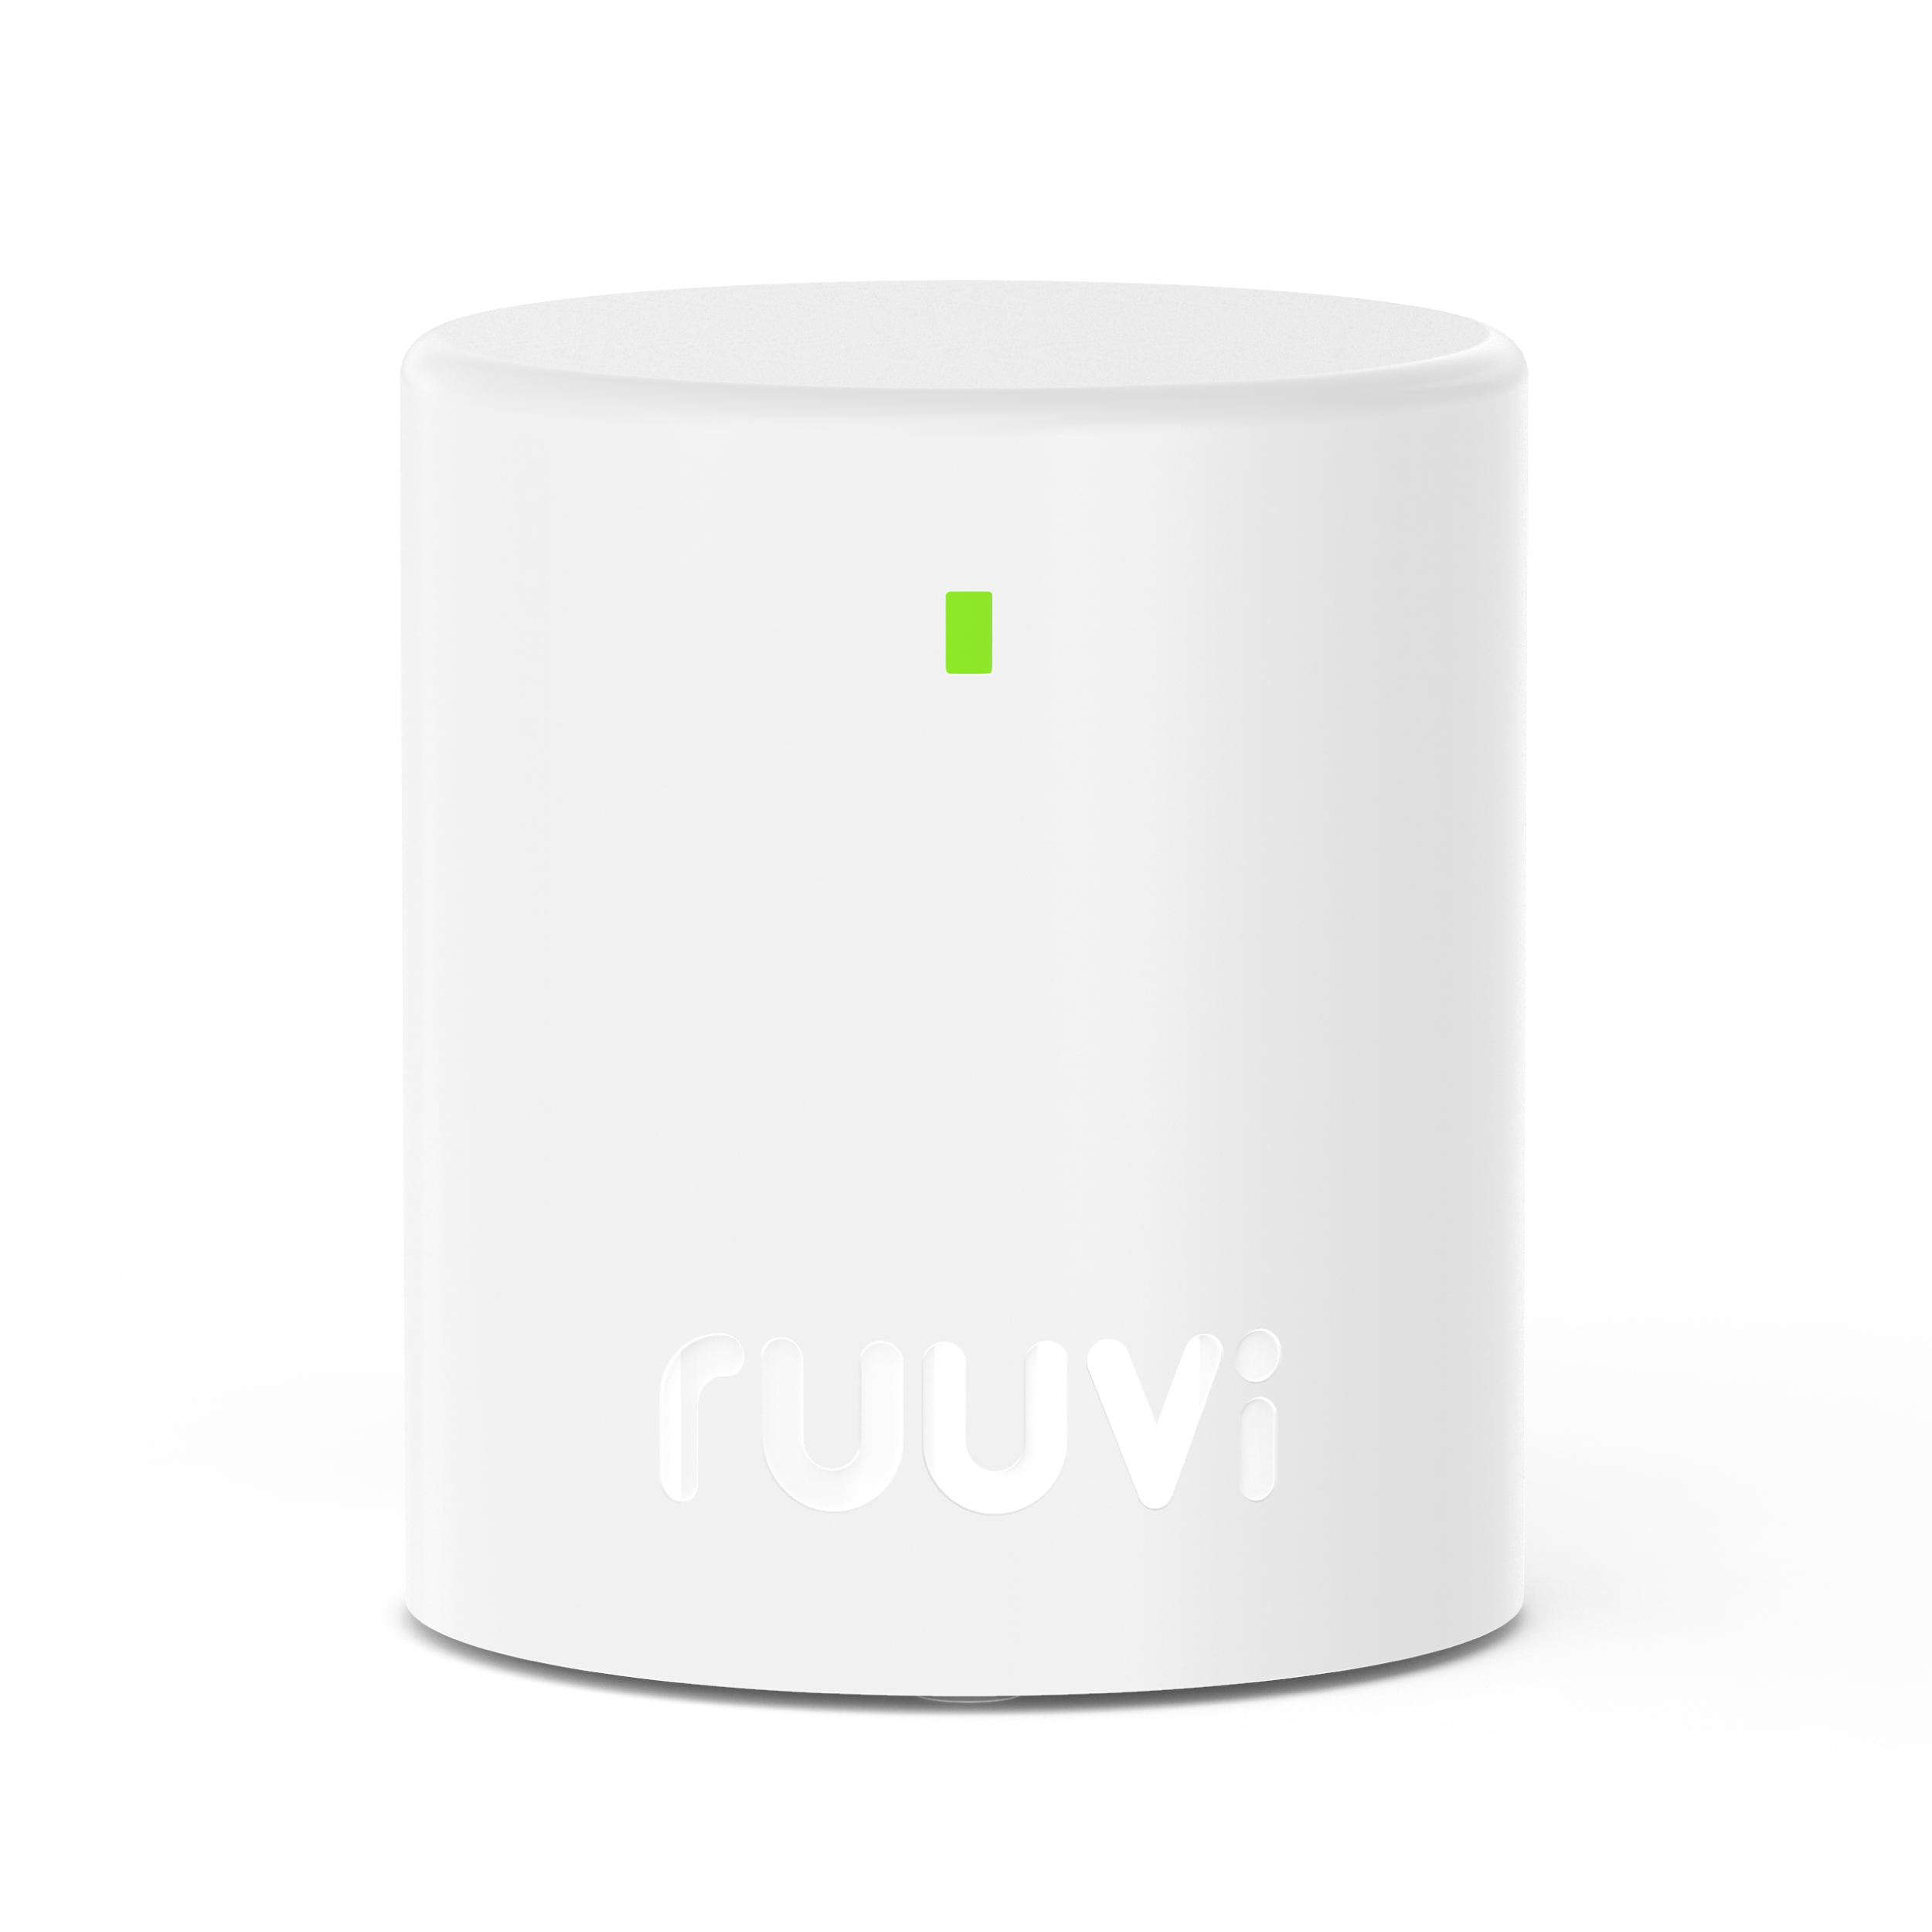
Introducing Ruuvi Air
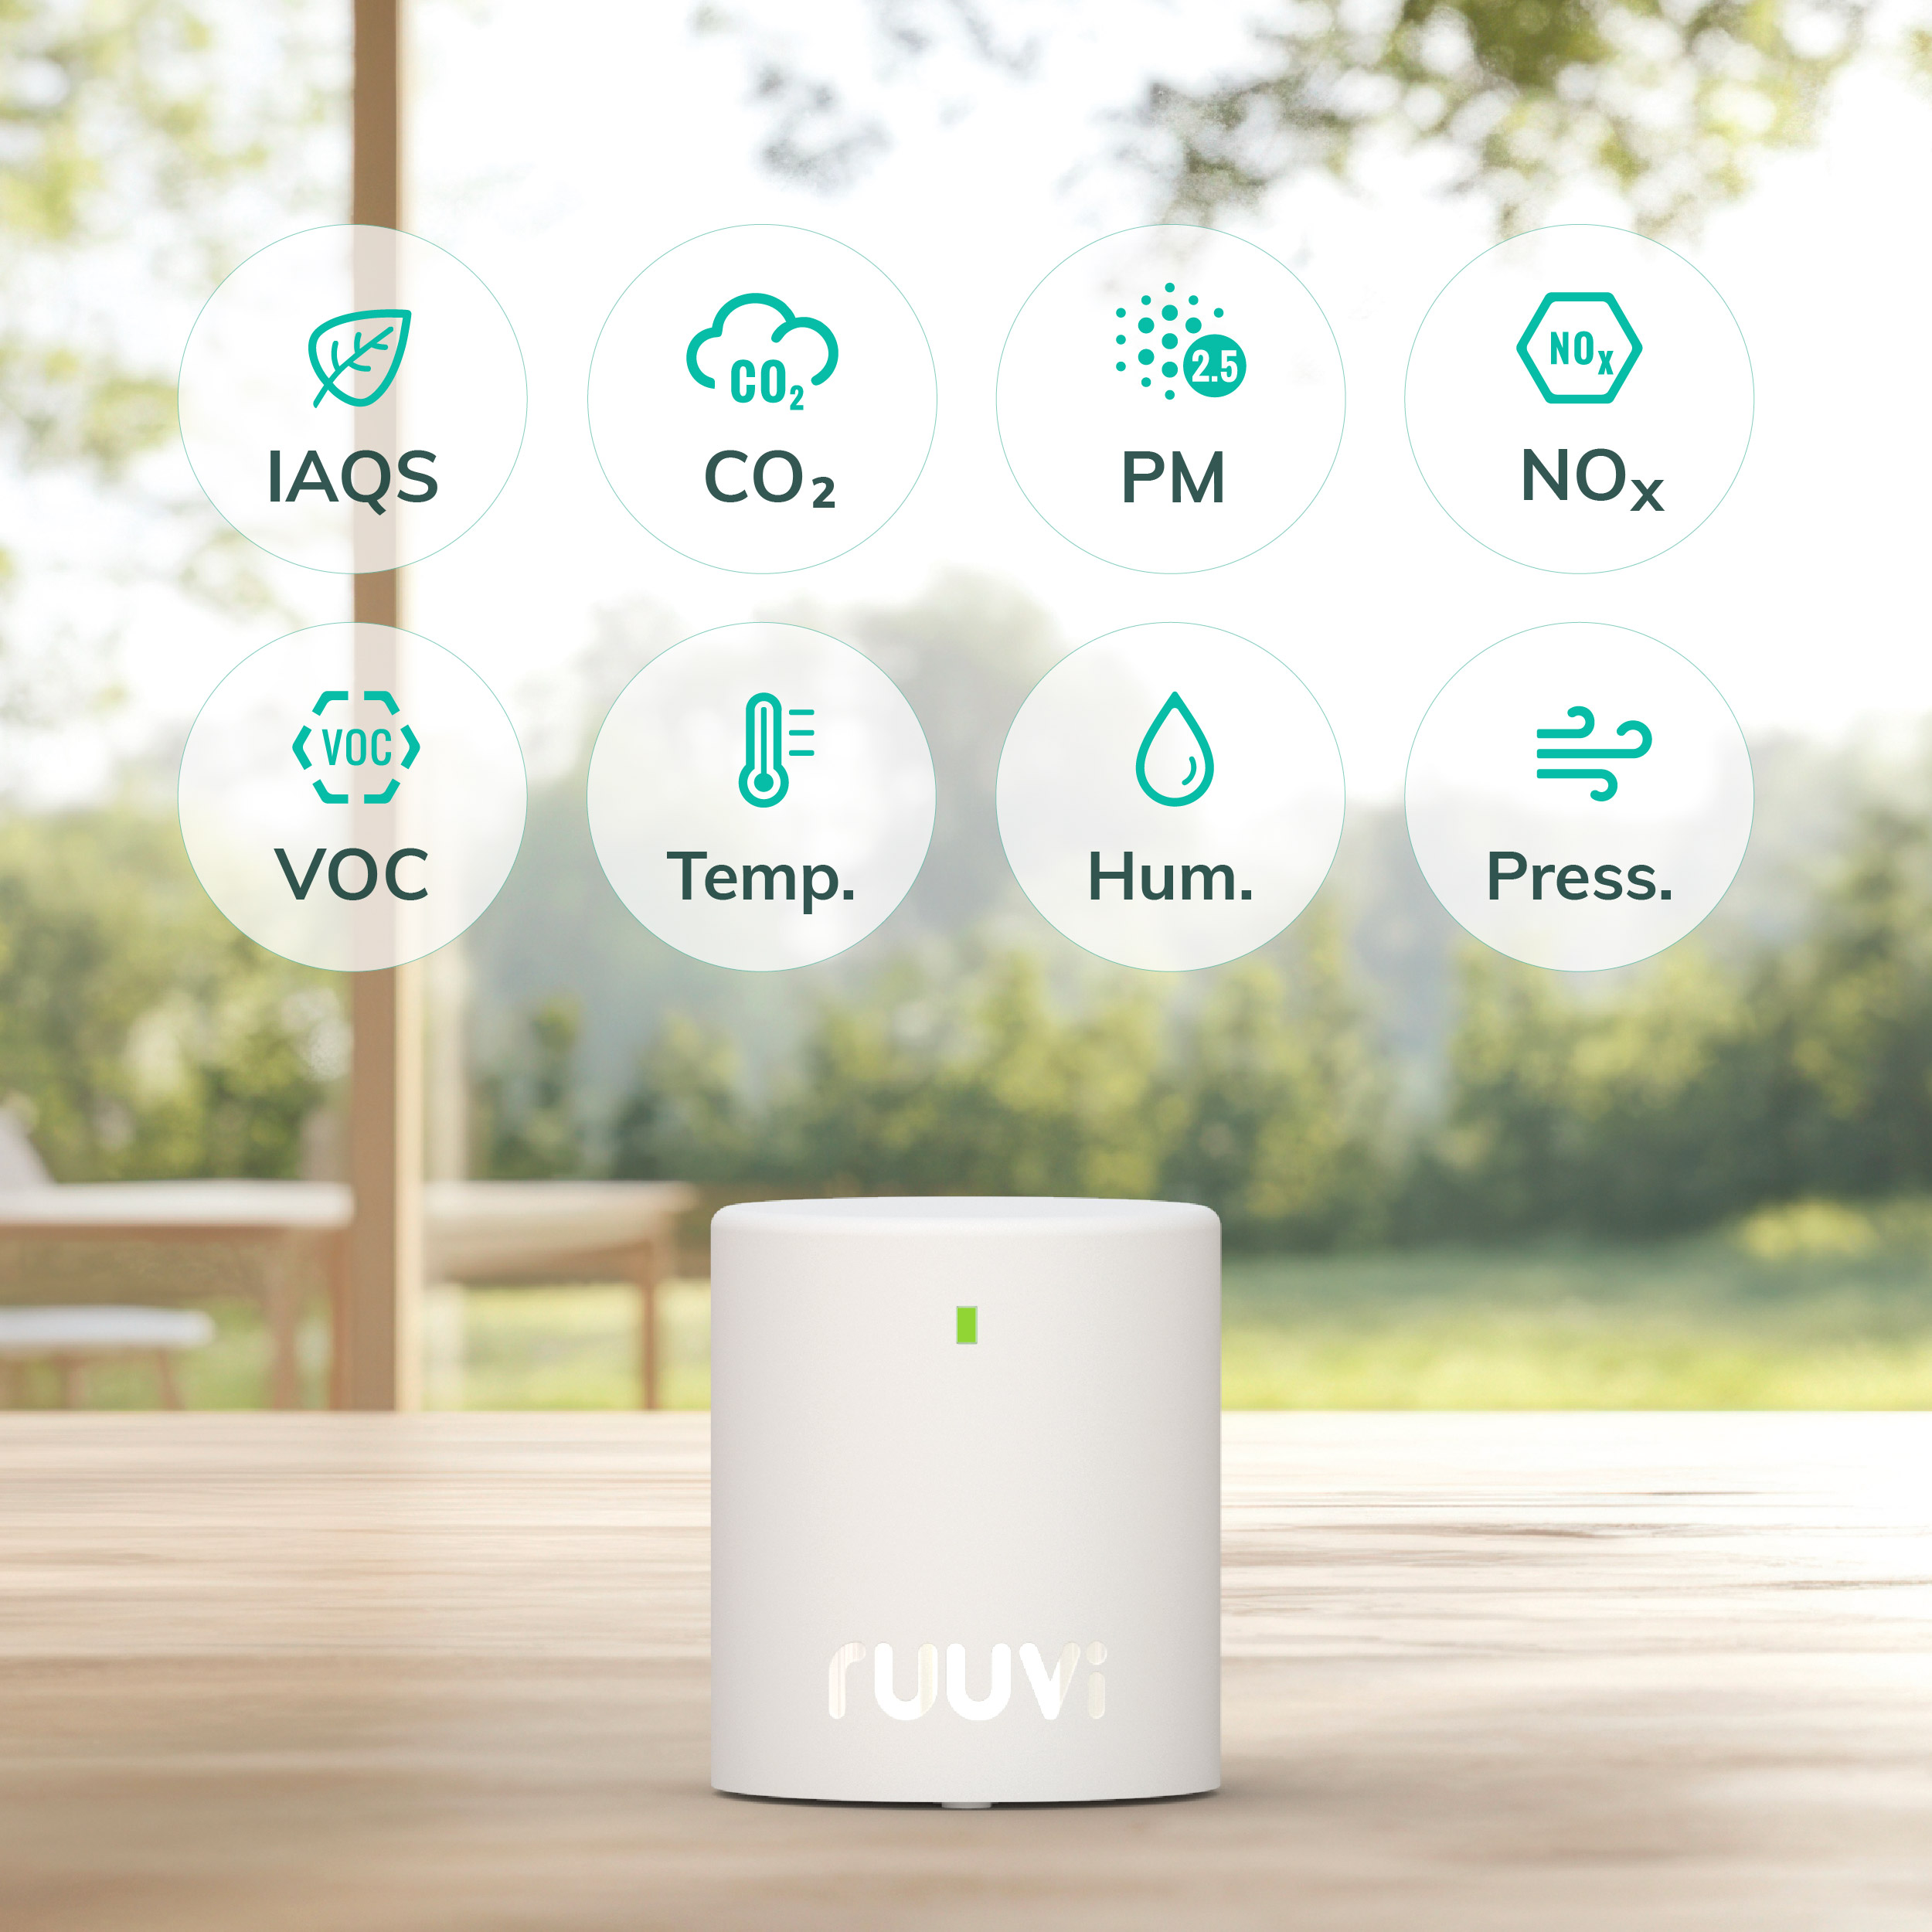
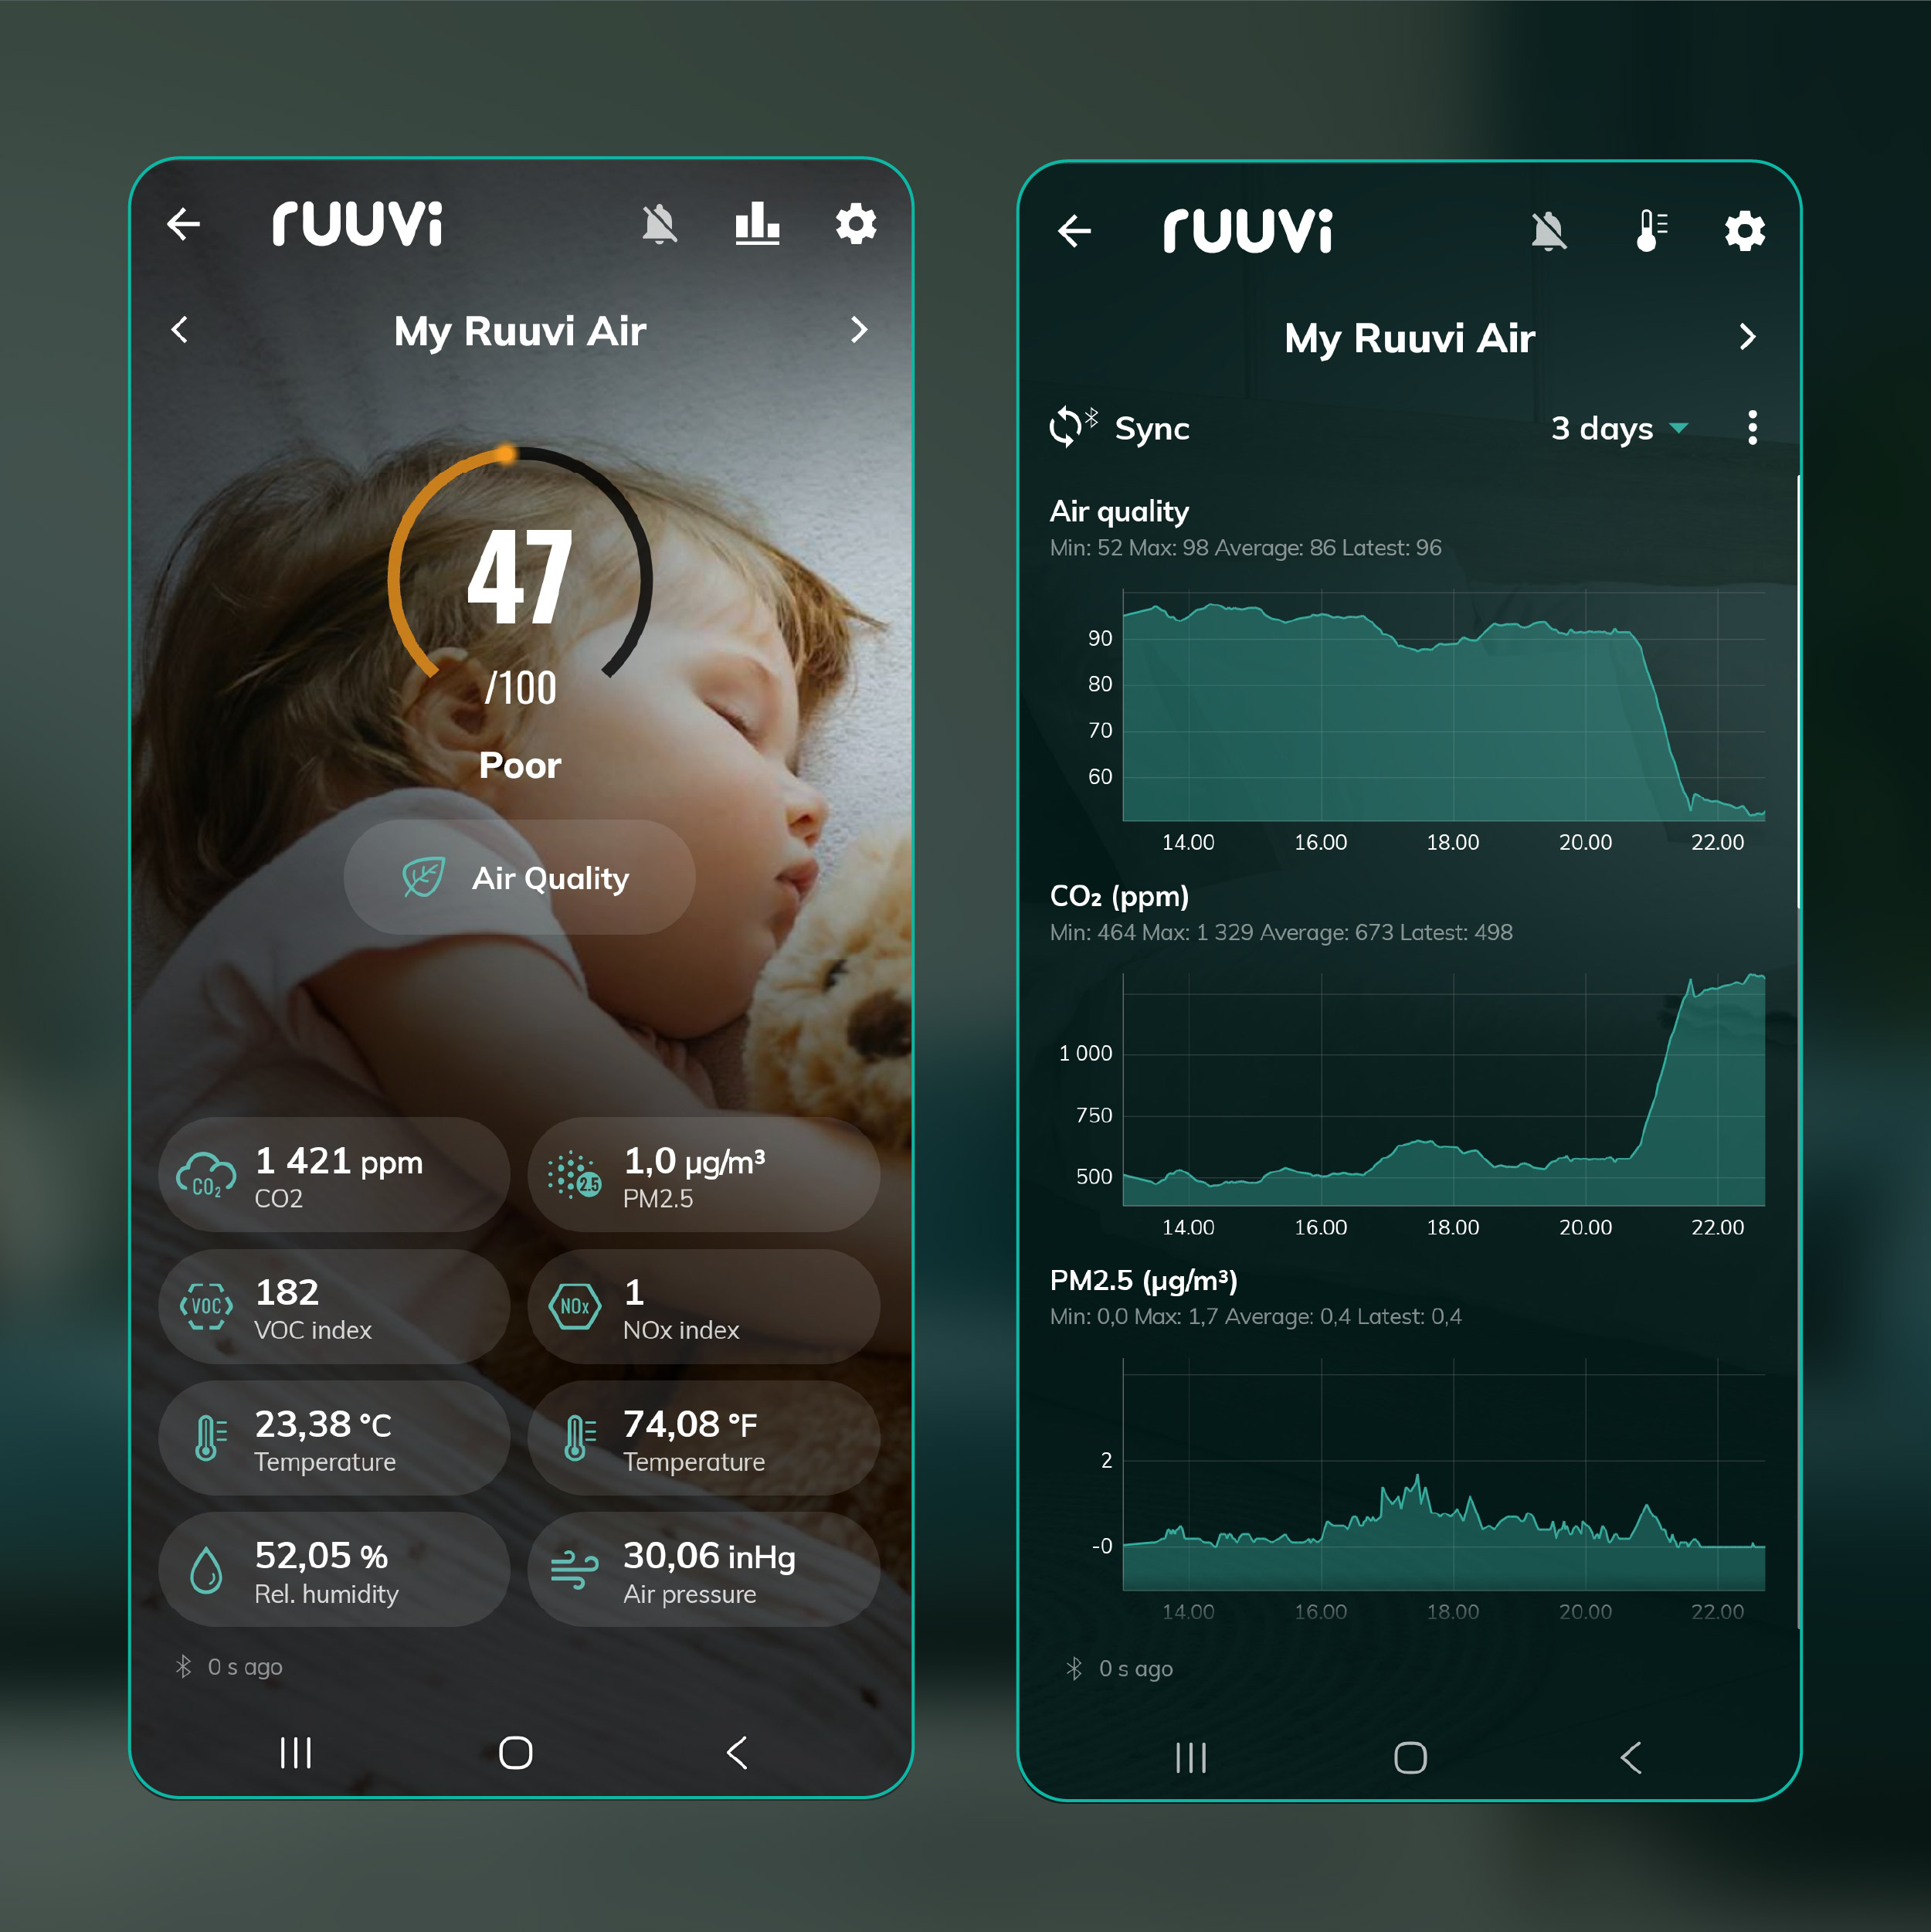
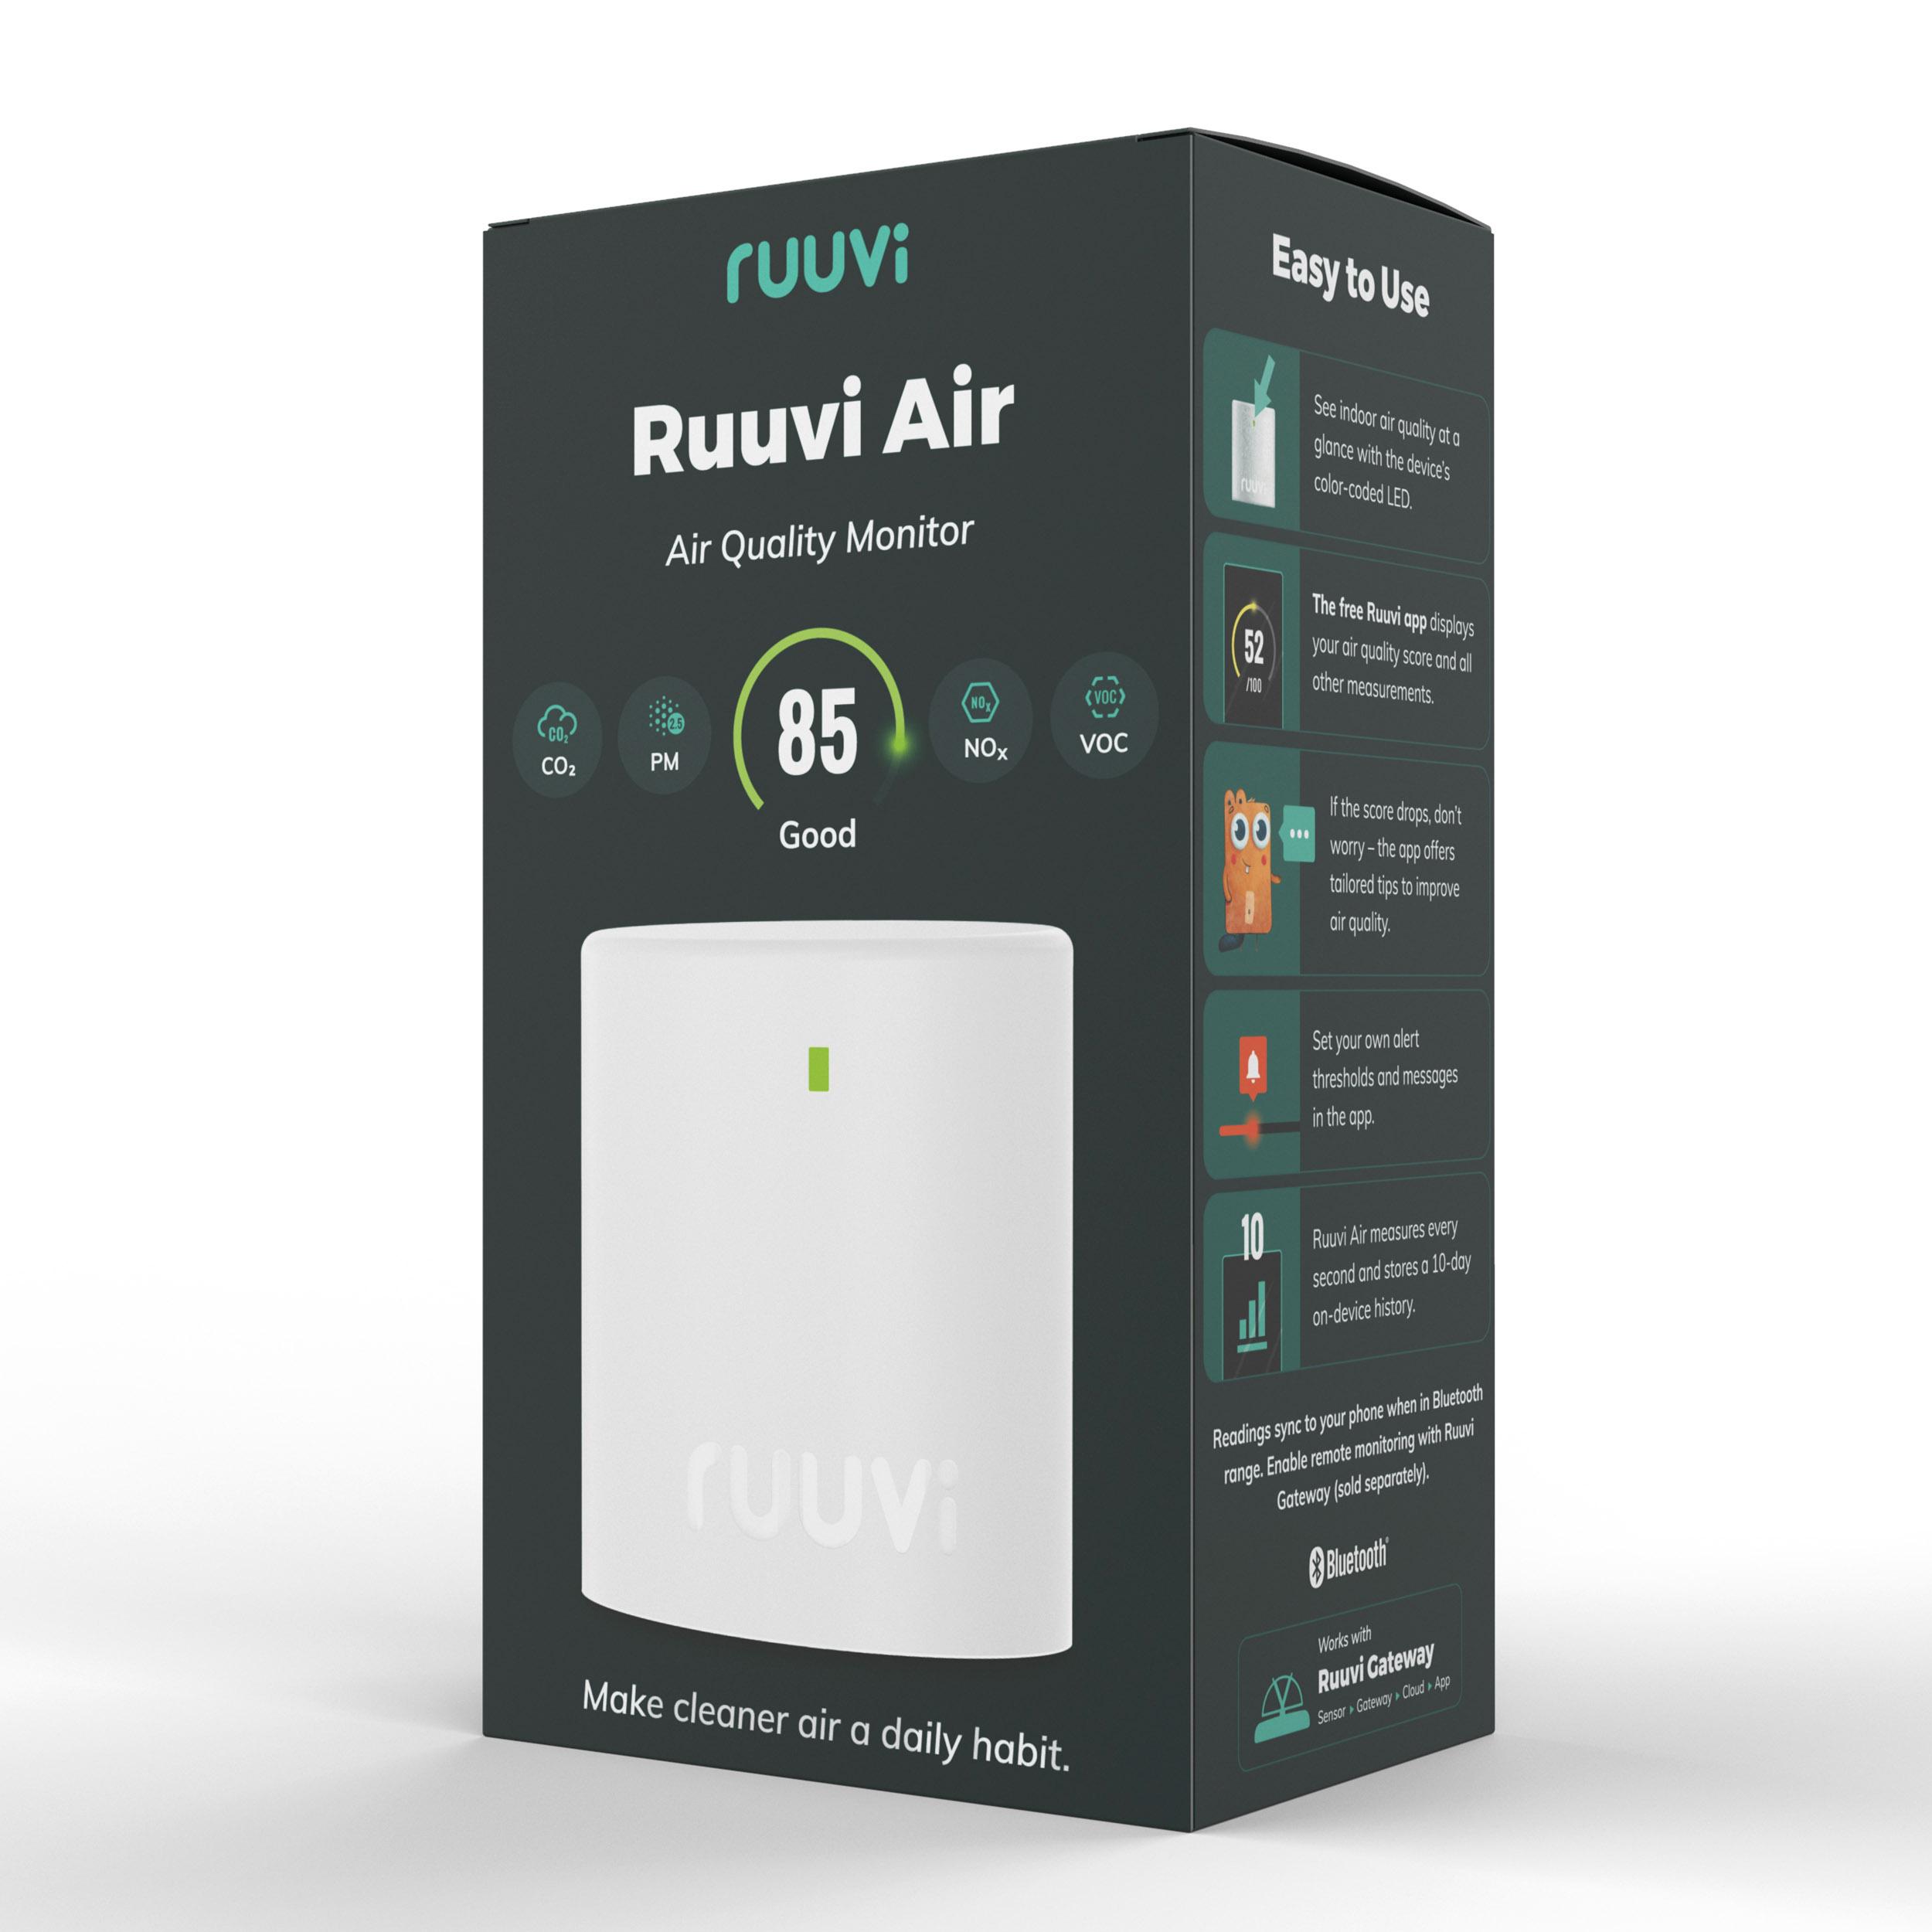
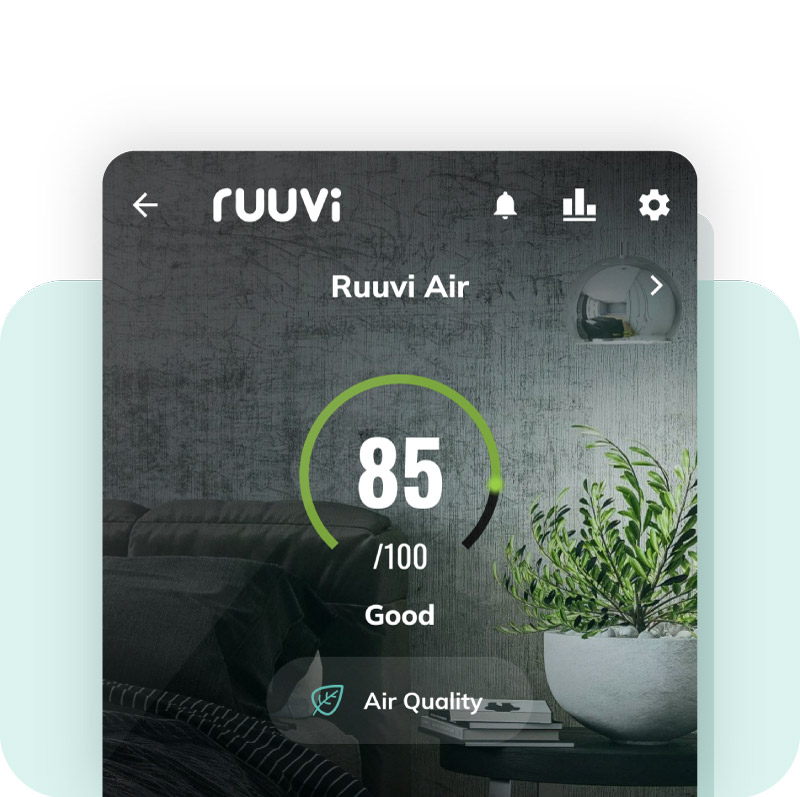
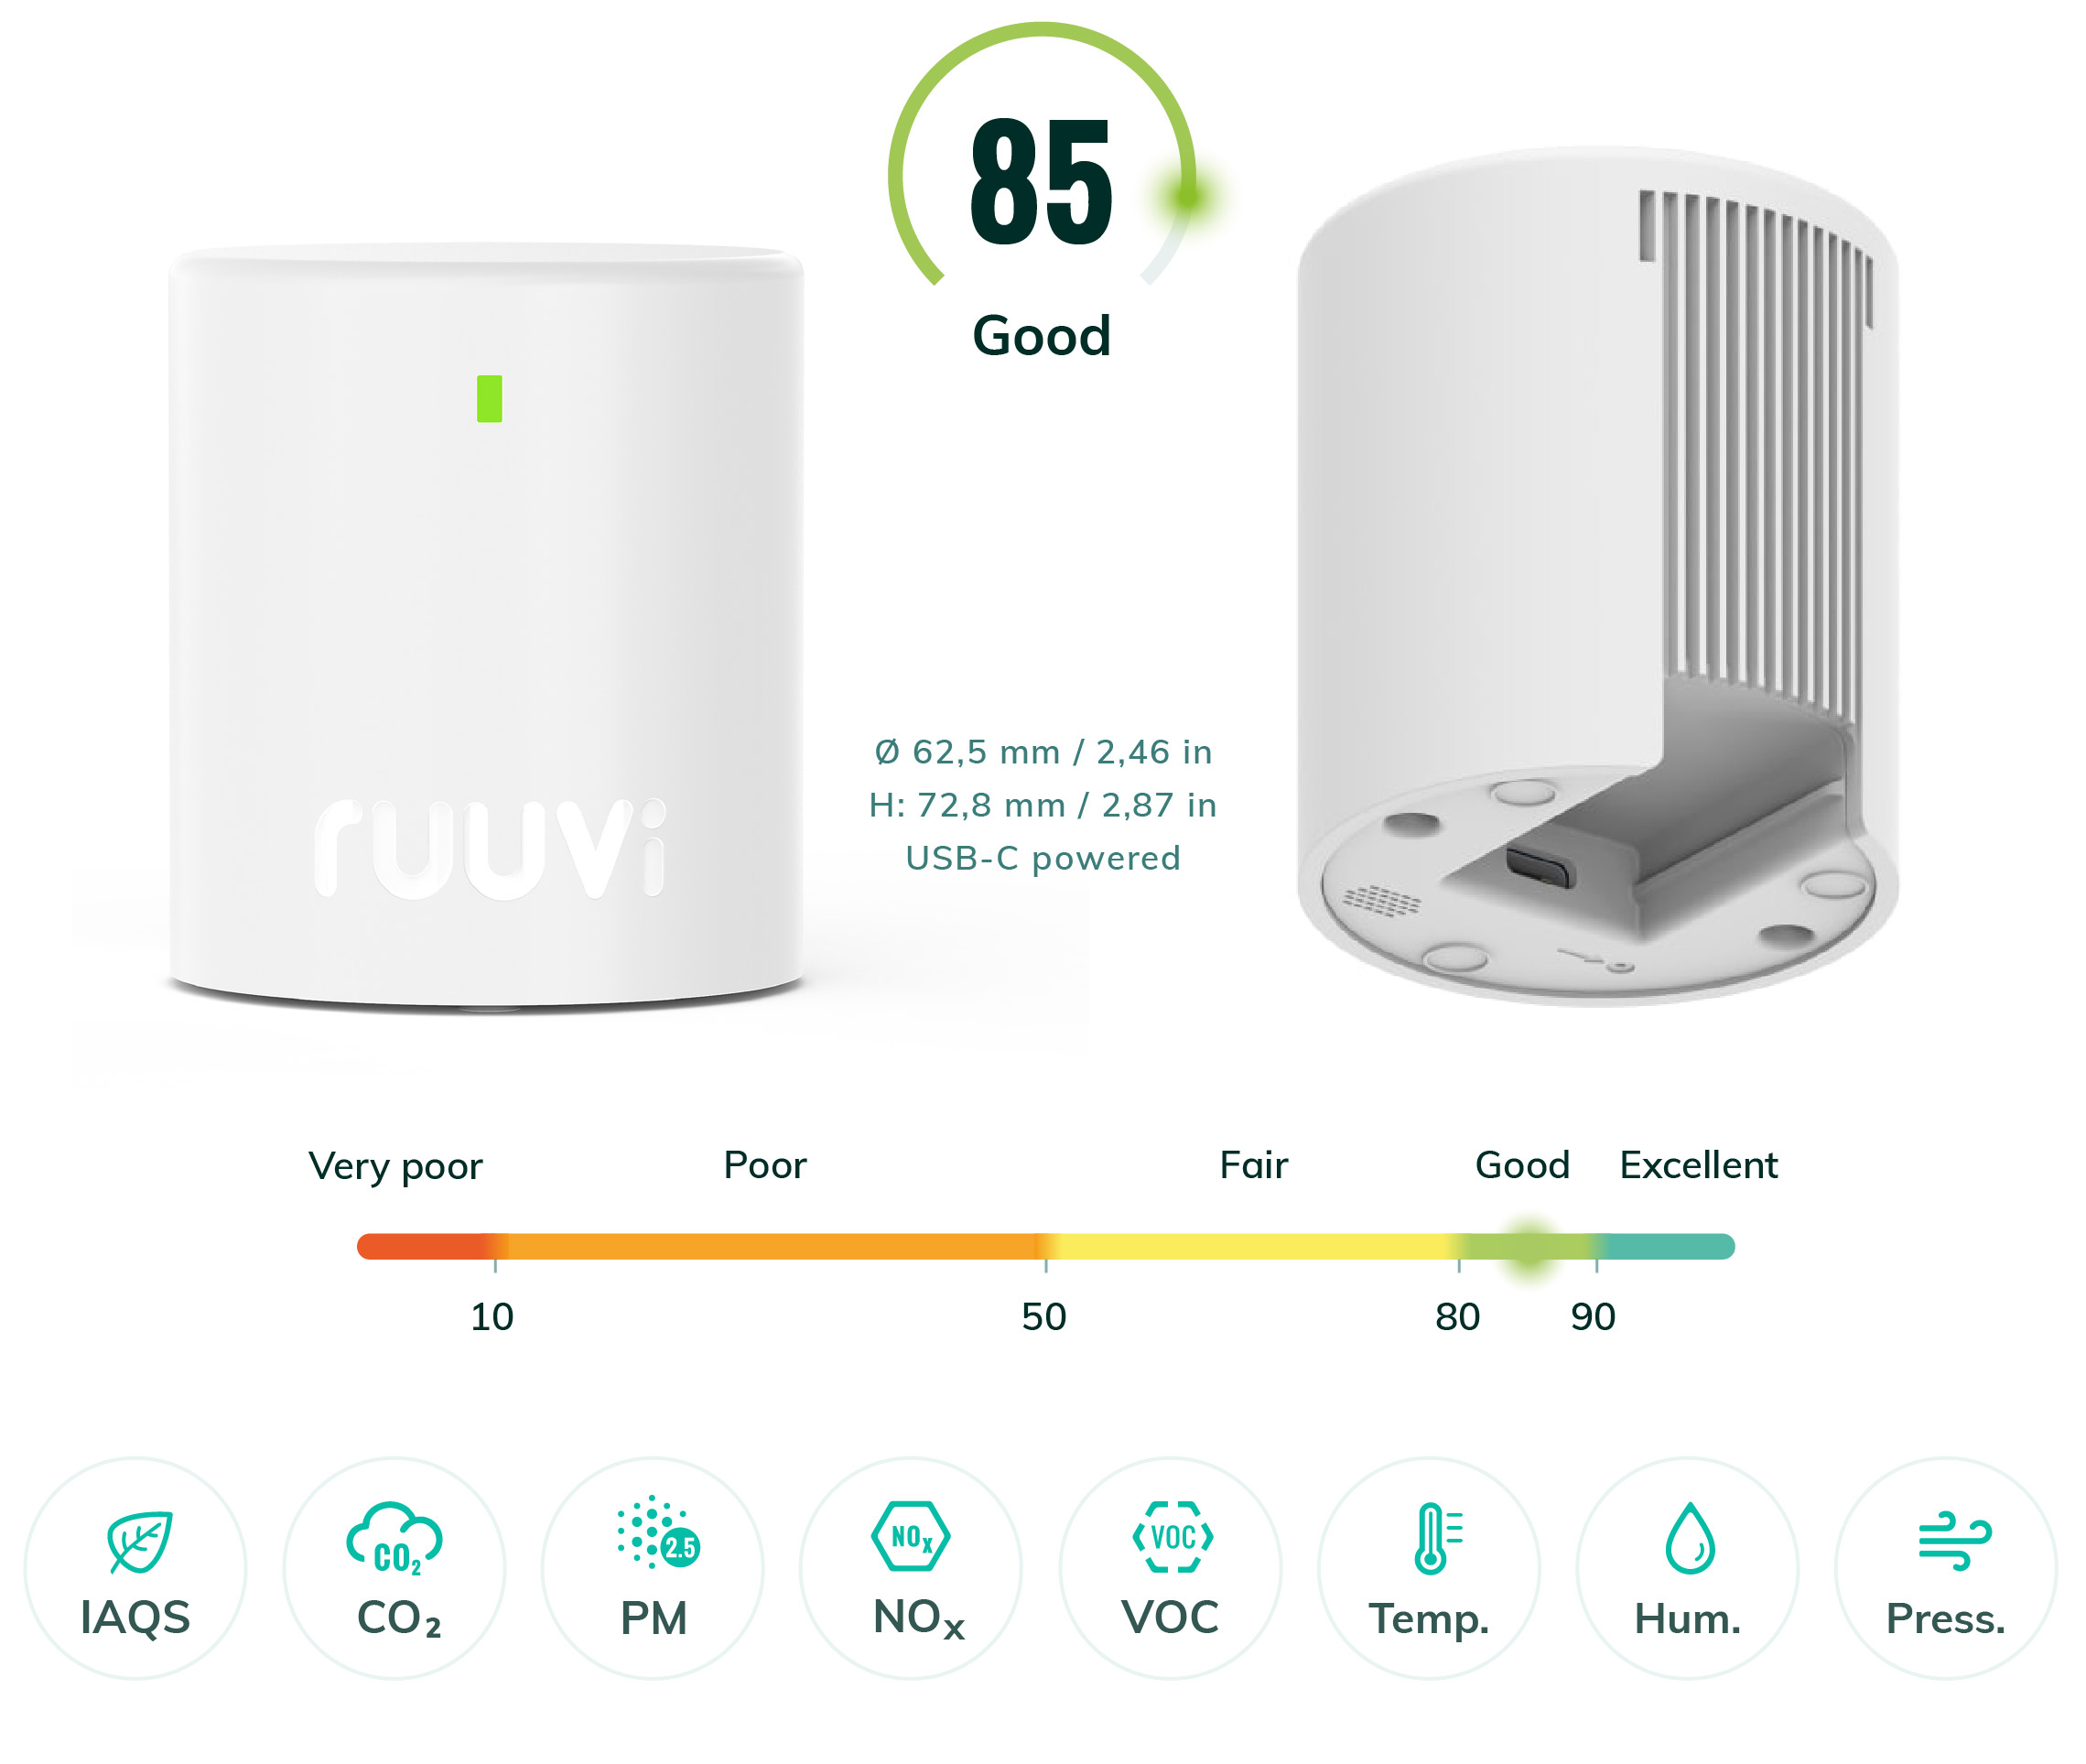
Ruuvi Air includes all essential air quality sensors and the Ruuvi Indoor Air Quality Score (IAQS), giving you a quick overview of how healthy your indoor air is. All measurements are sent directly to your mobile device.
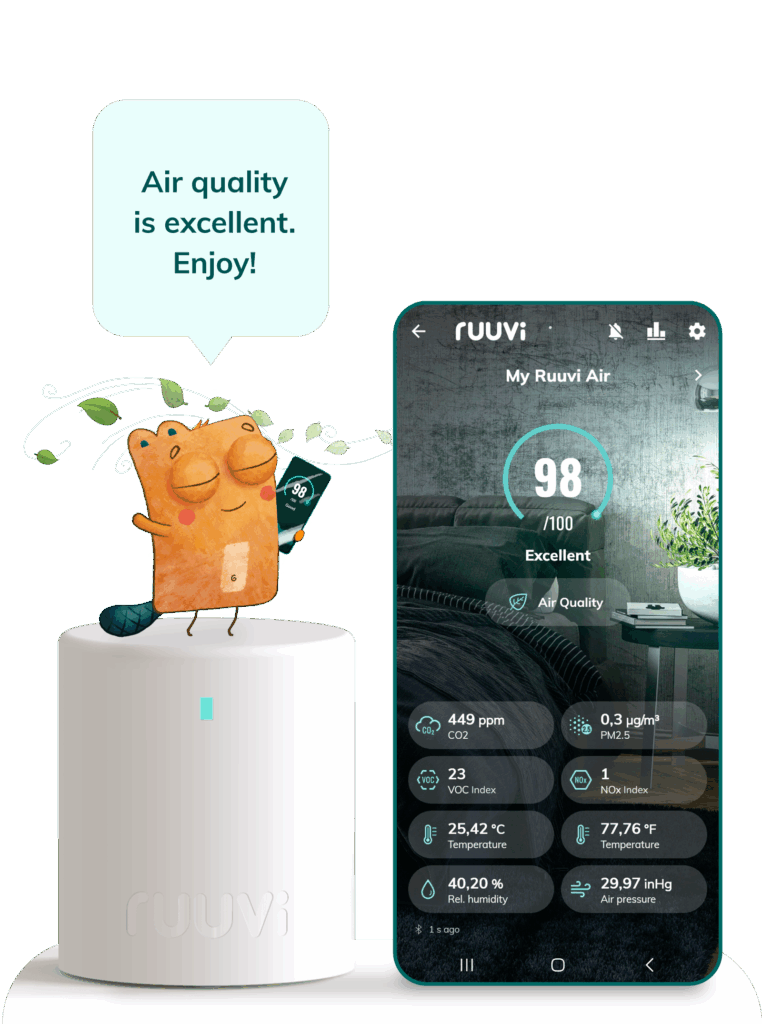
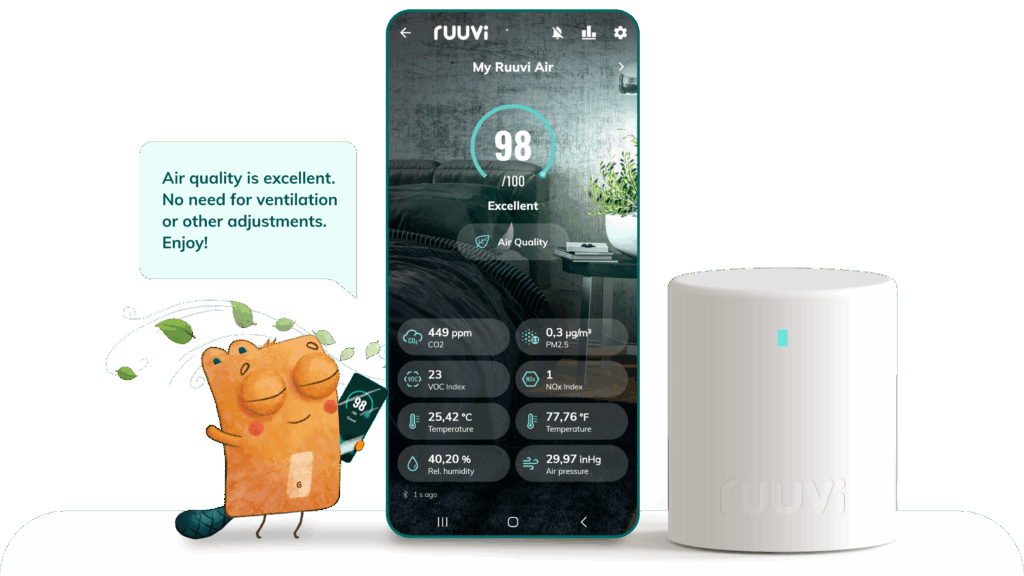
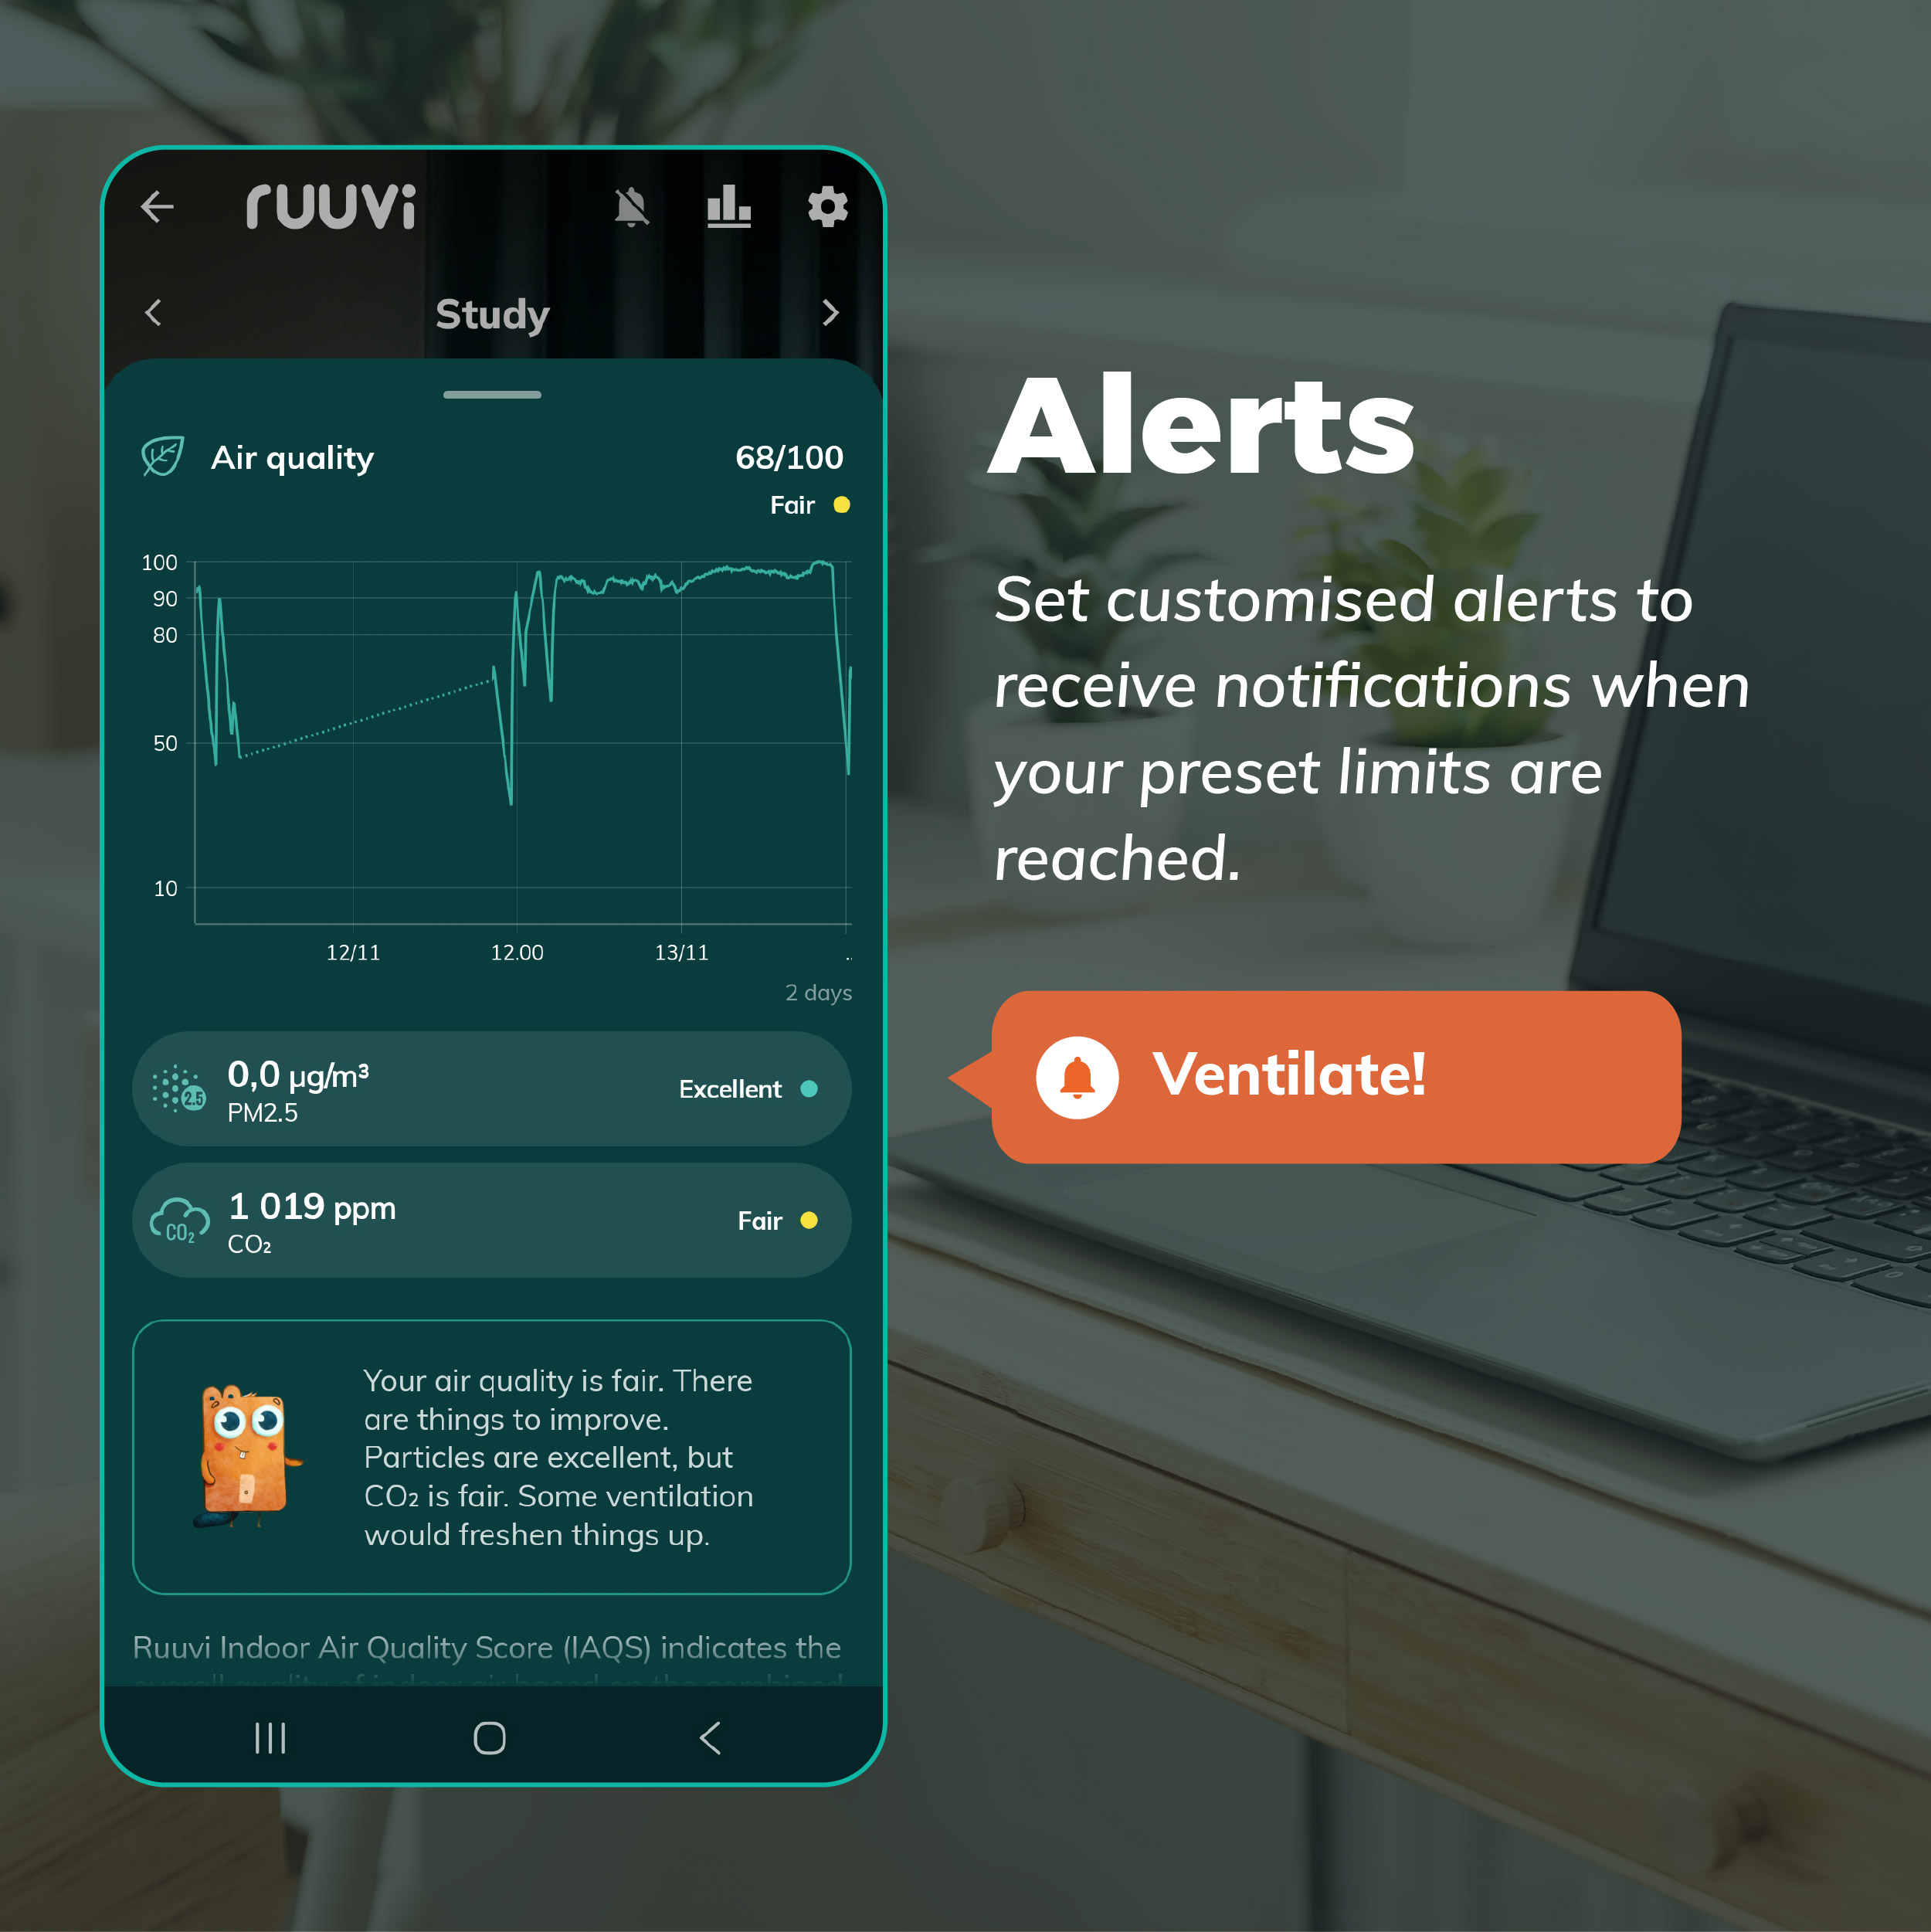
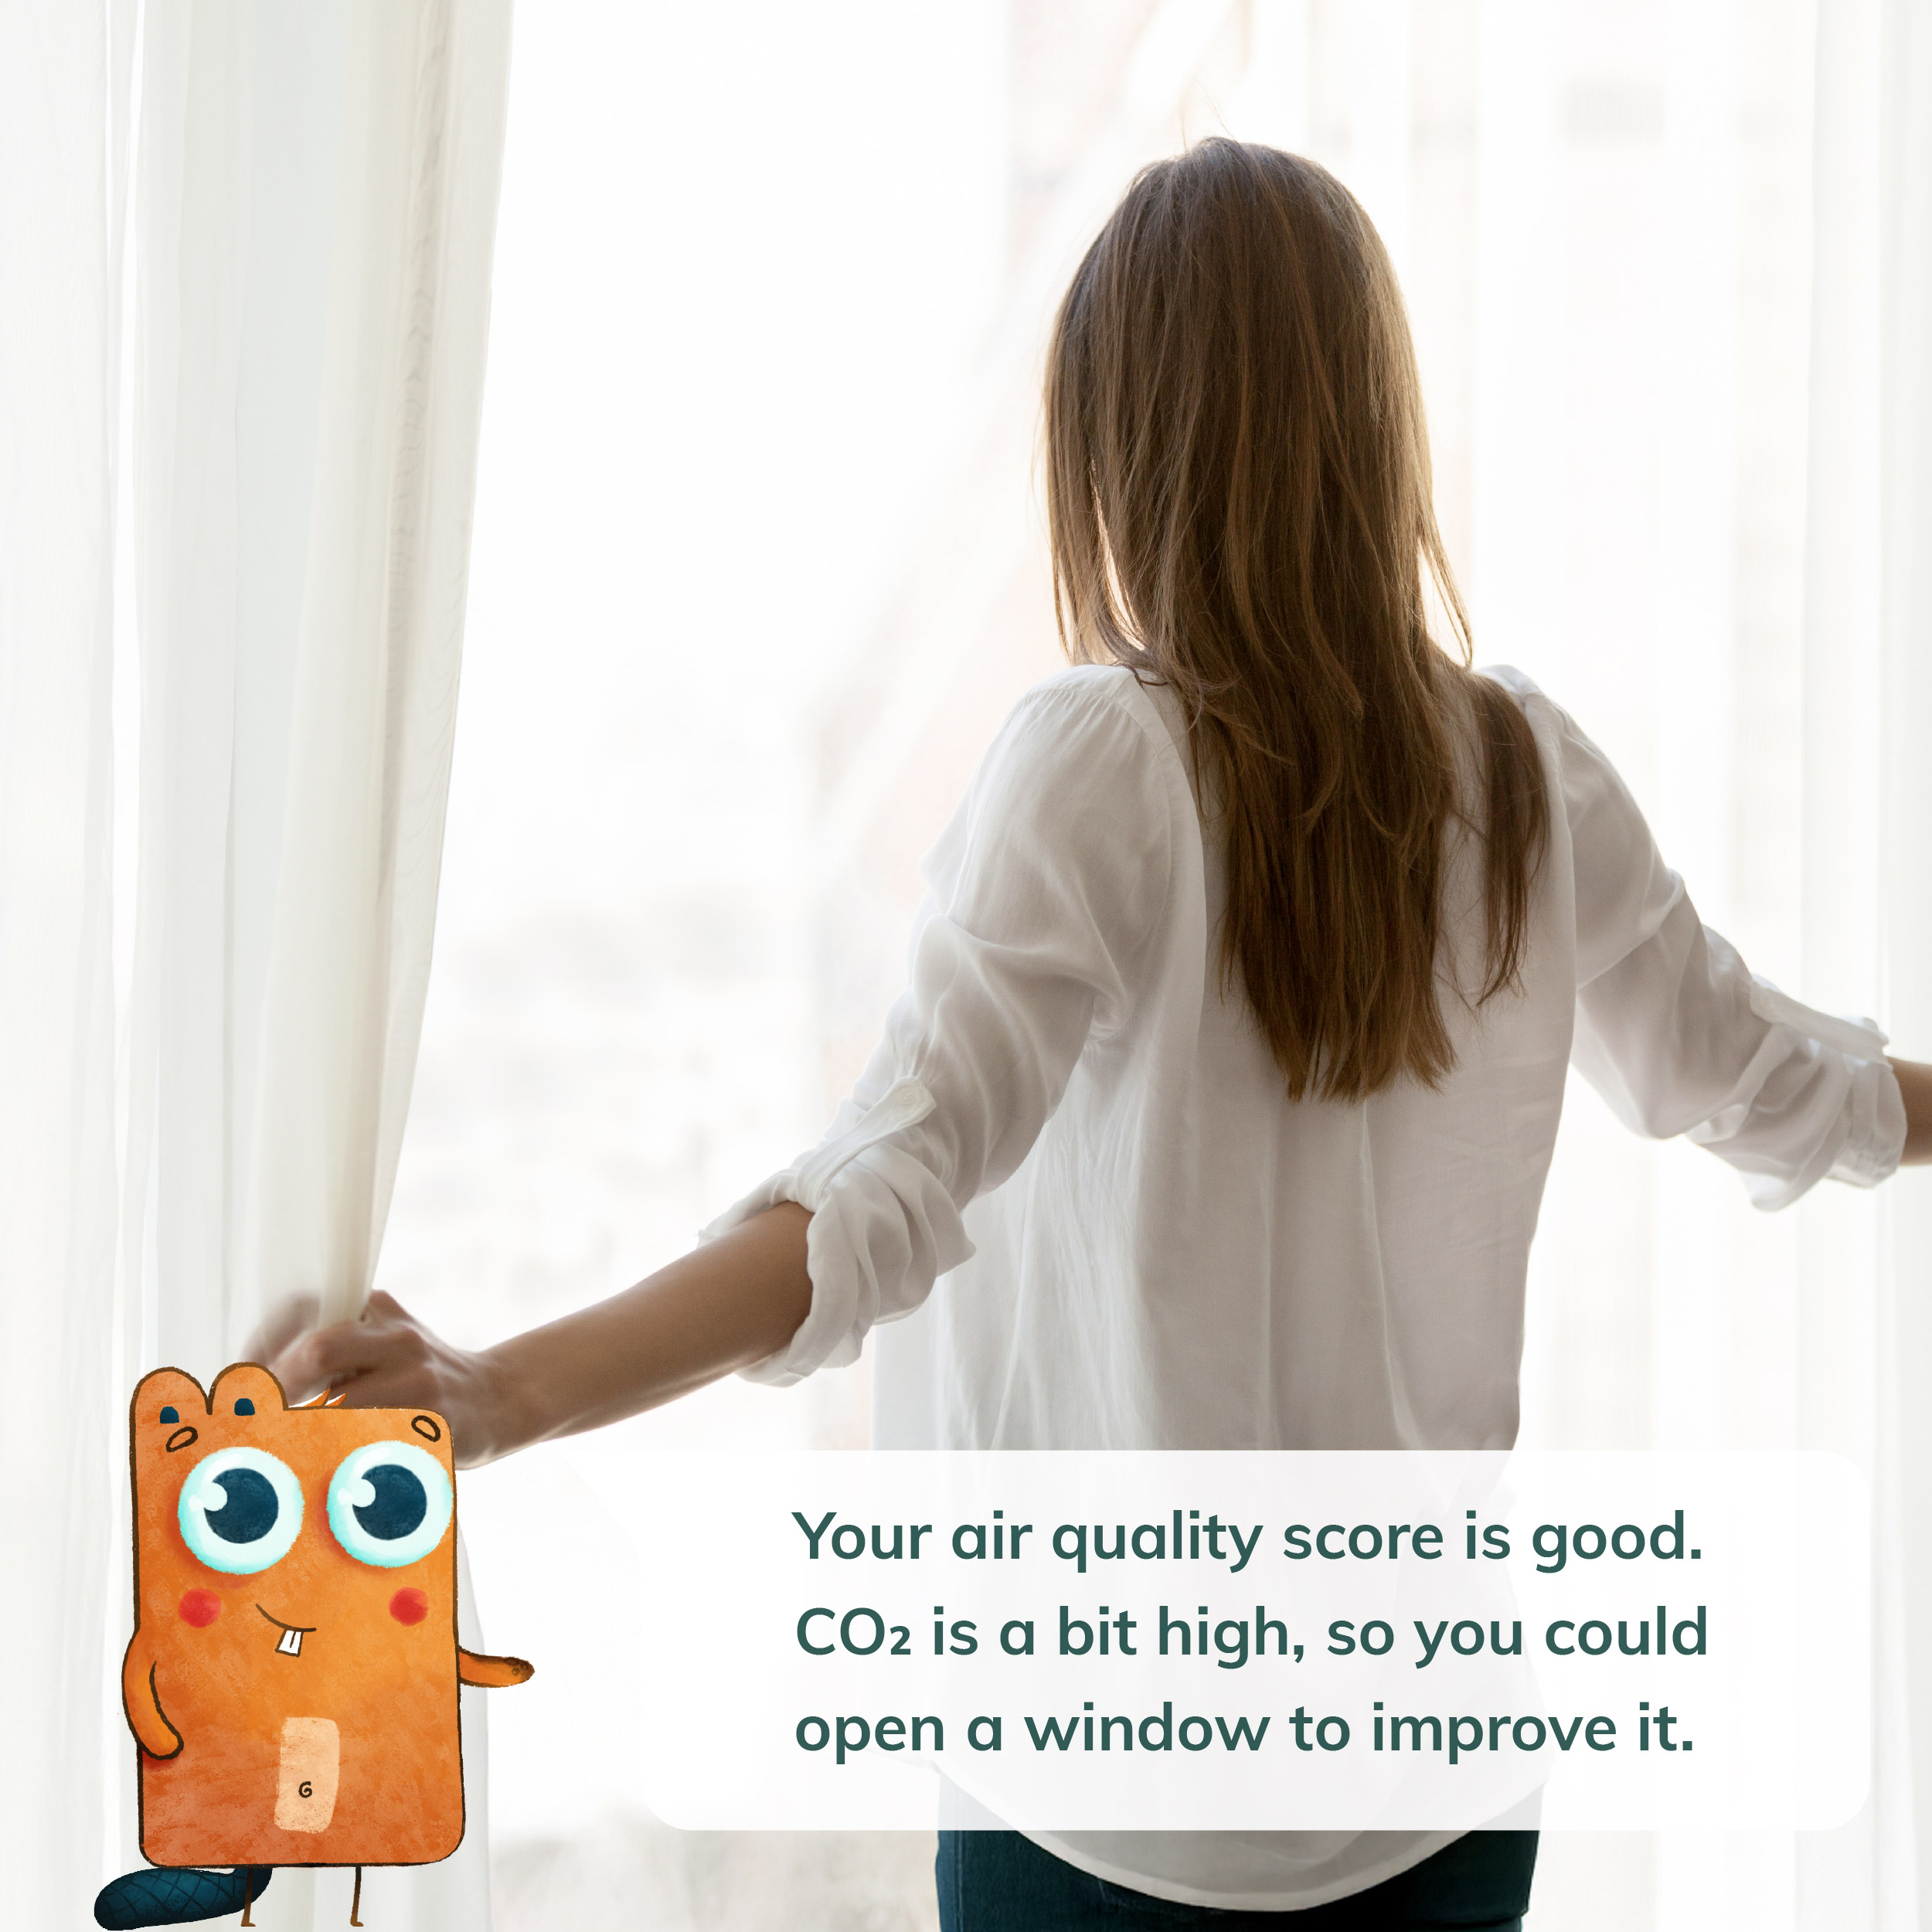
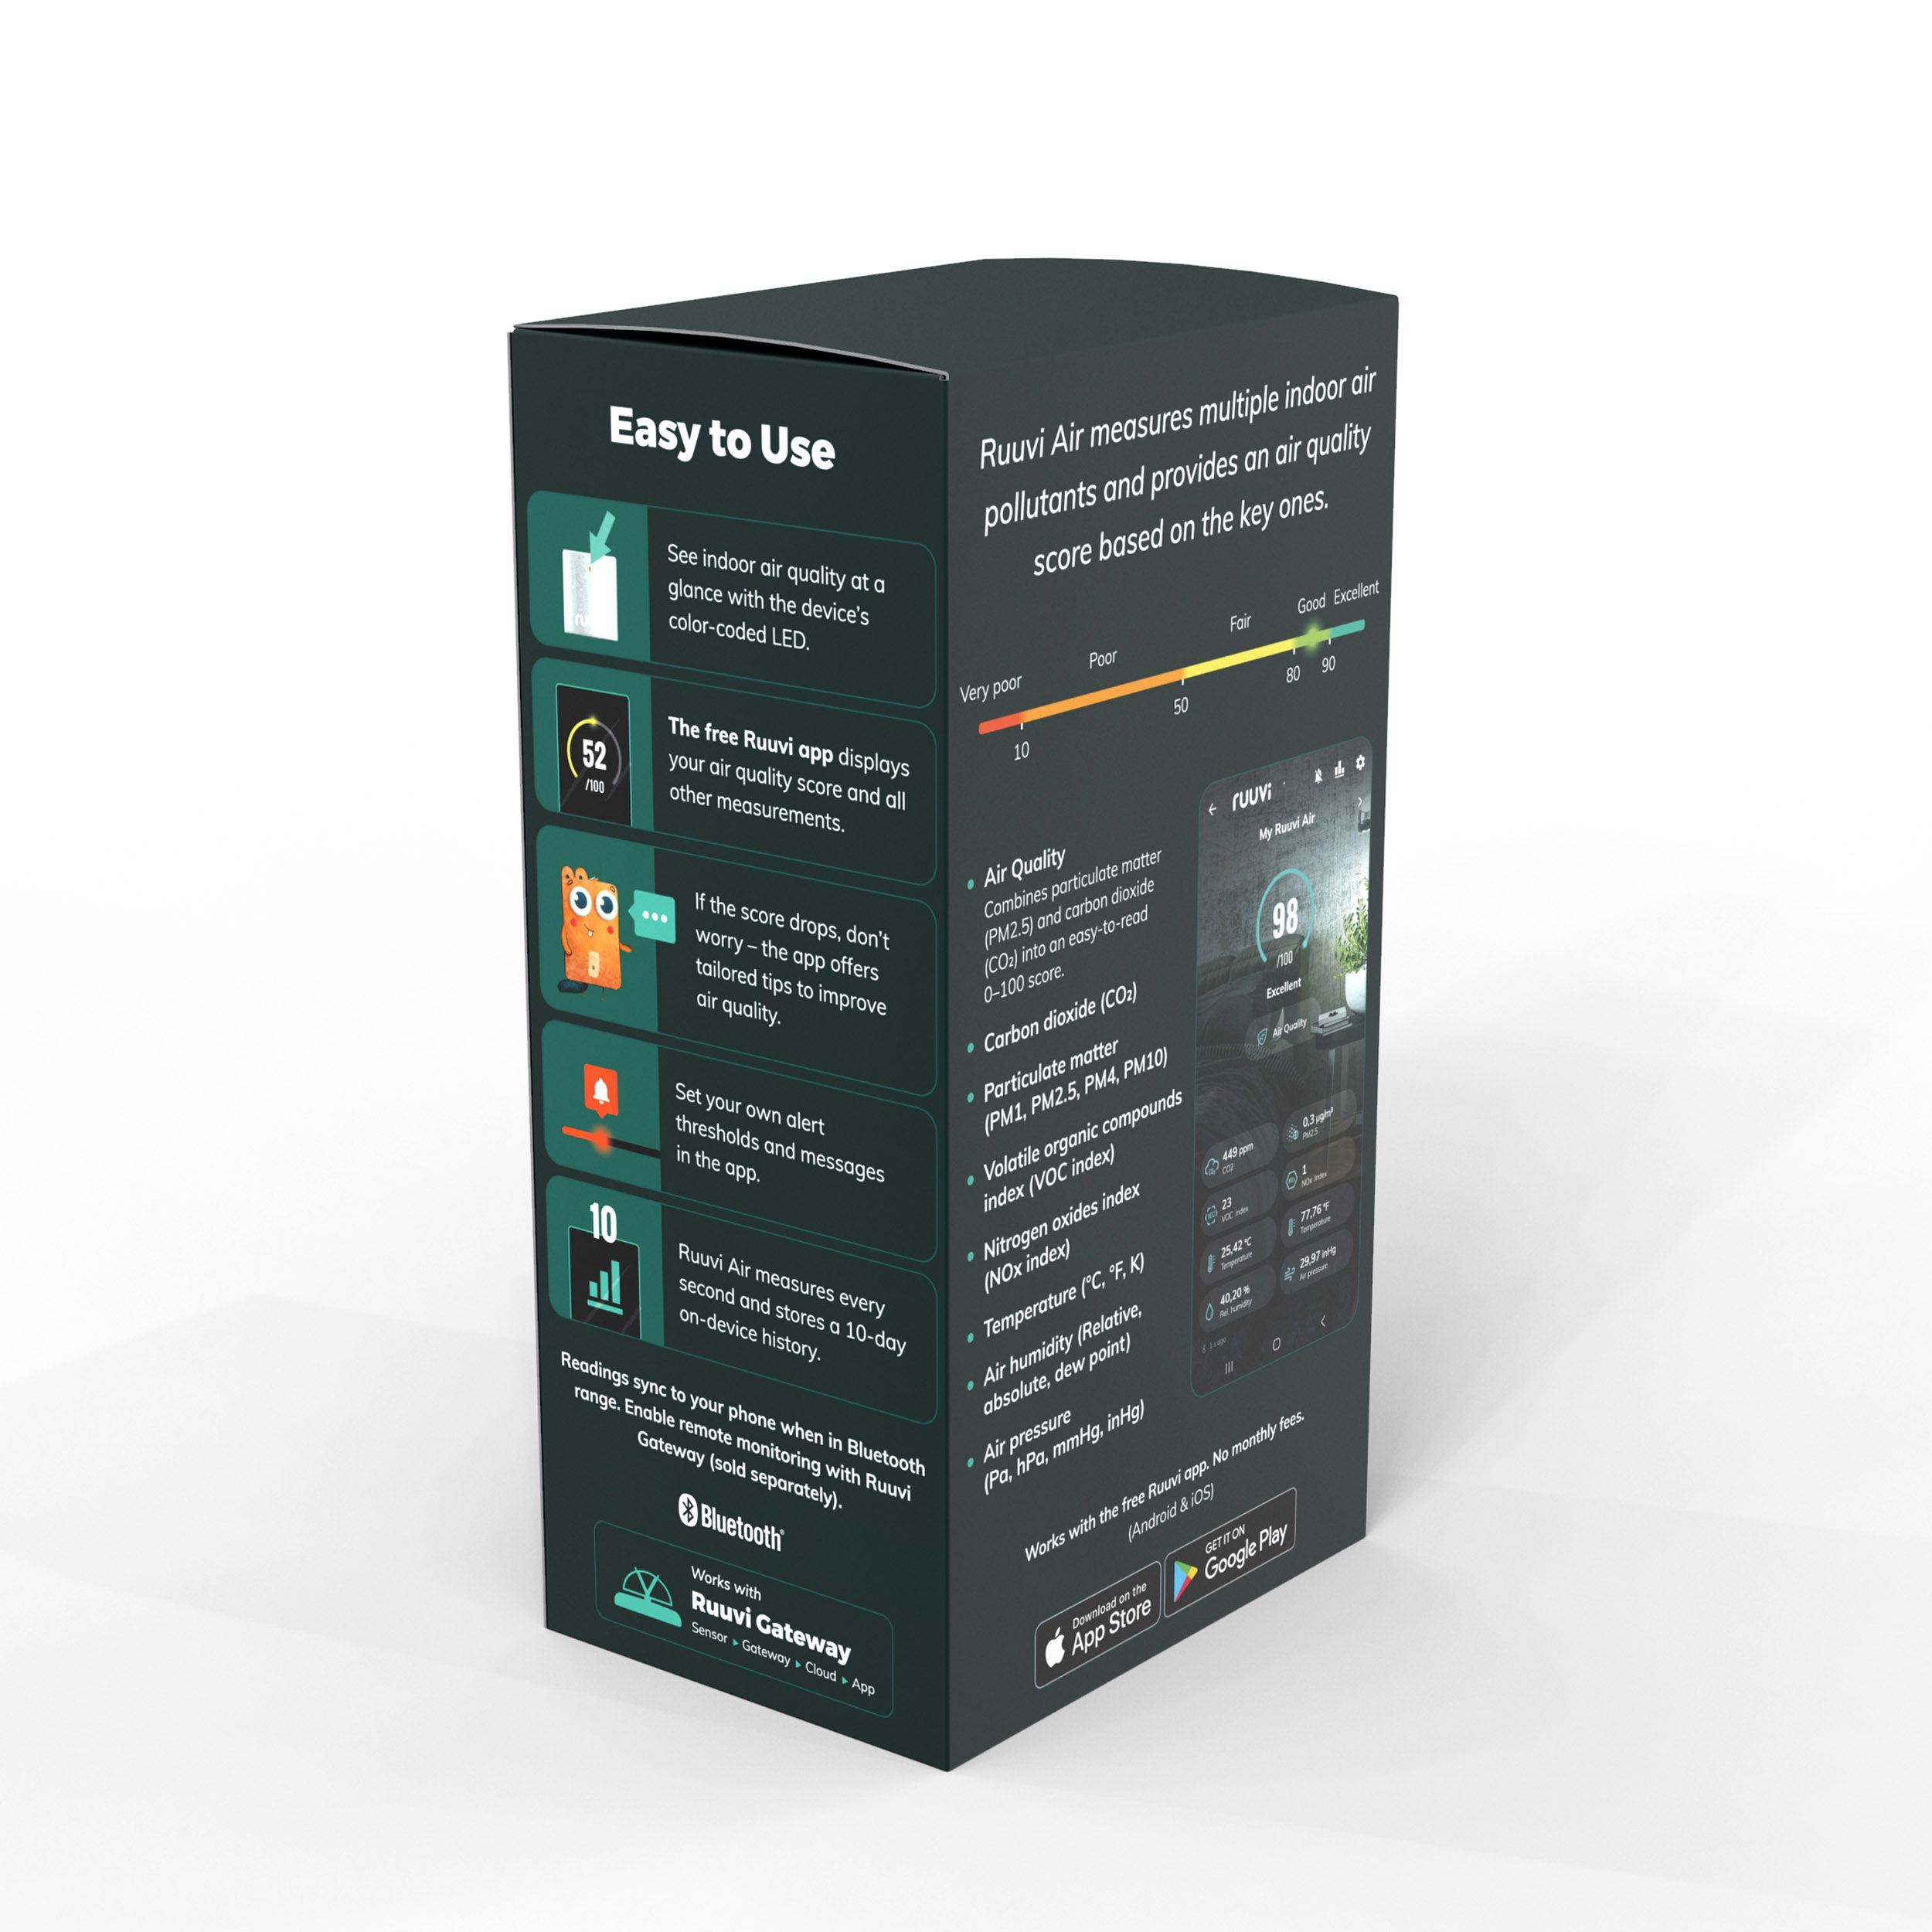
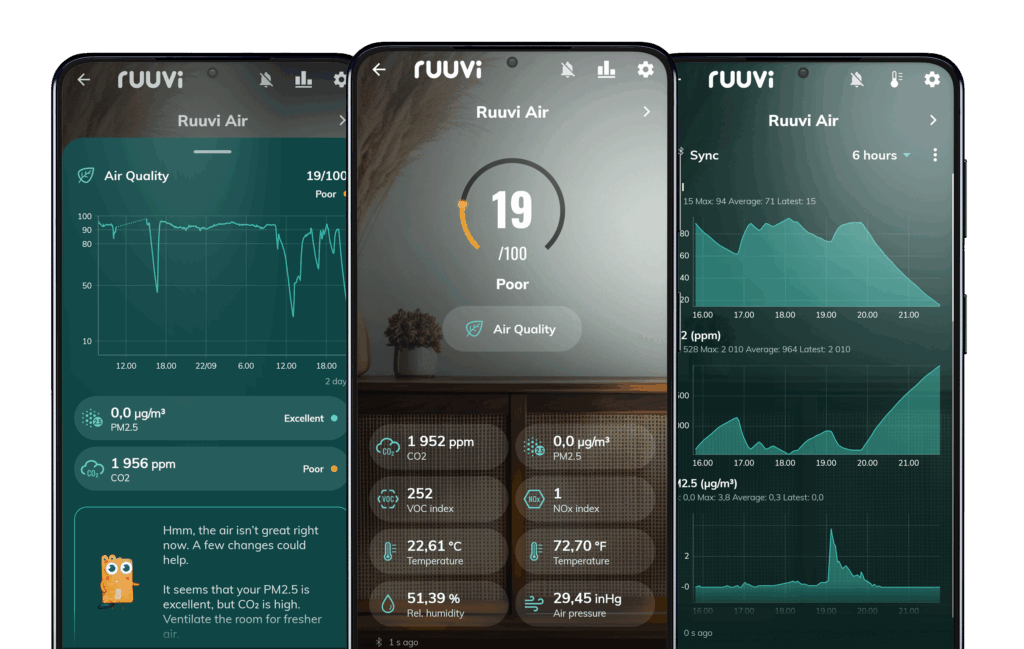
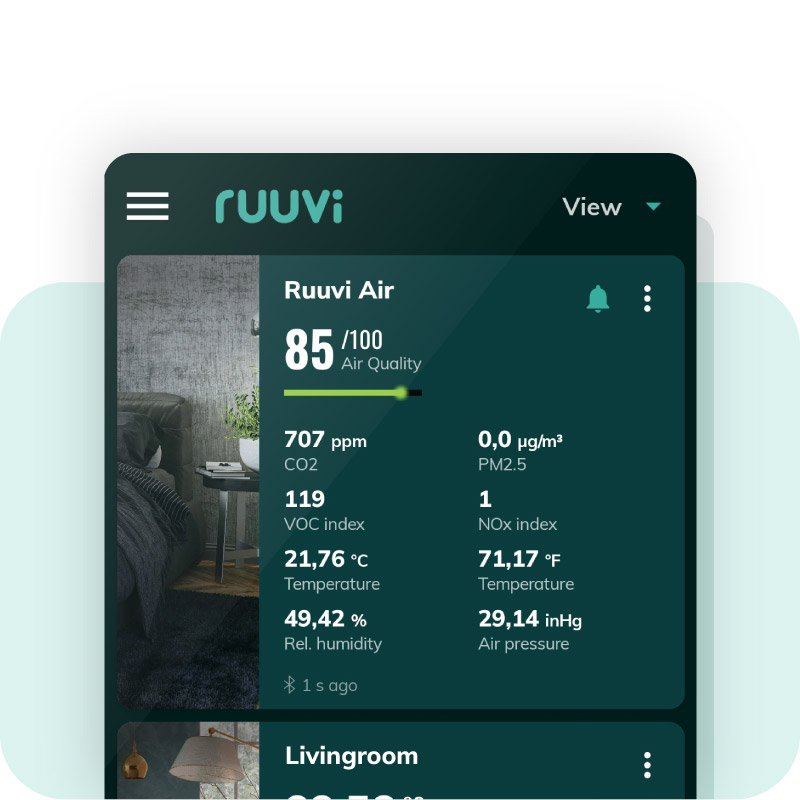
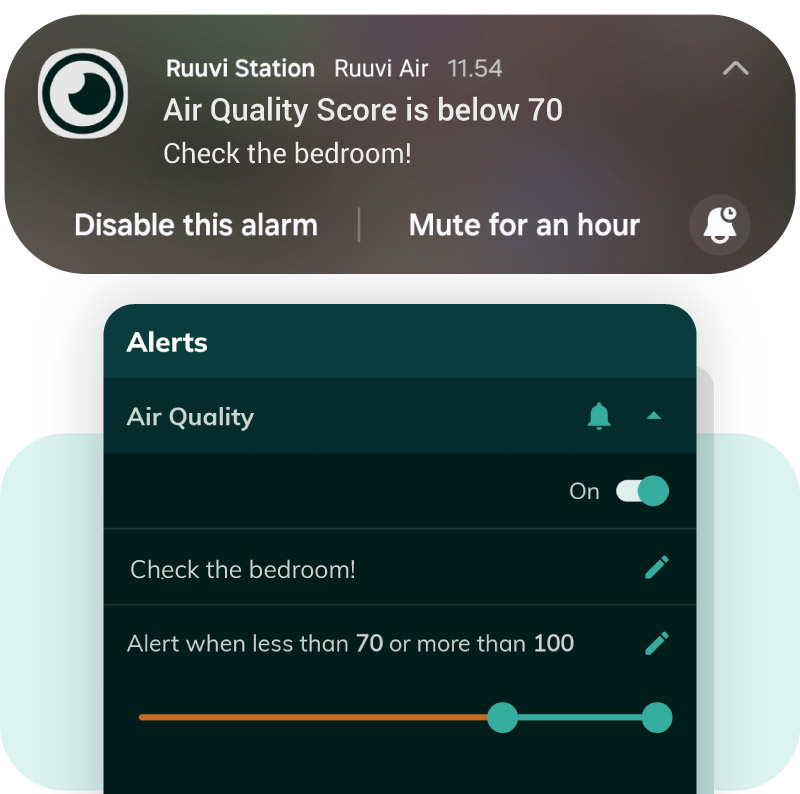
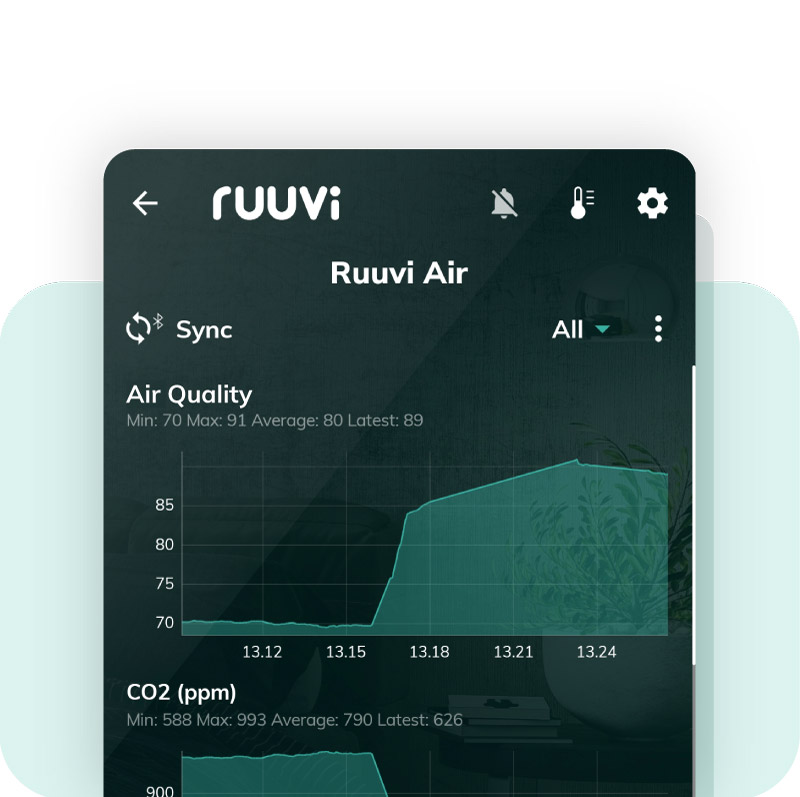
The Ruuvi Station mobile app lets you view your air quality status, real-time measurements for all parameters, detailed readings, and historical graphs. You can set and receive customisable alerts when conditions reach critical levels. For added support, the app offers tailored tips based on your air quality results to help you take meaningful action.
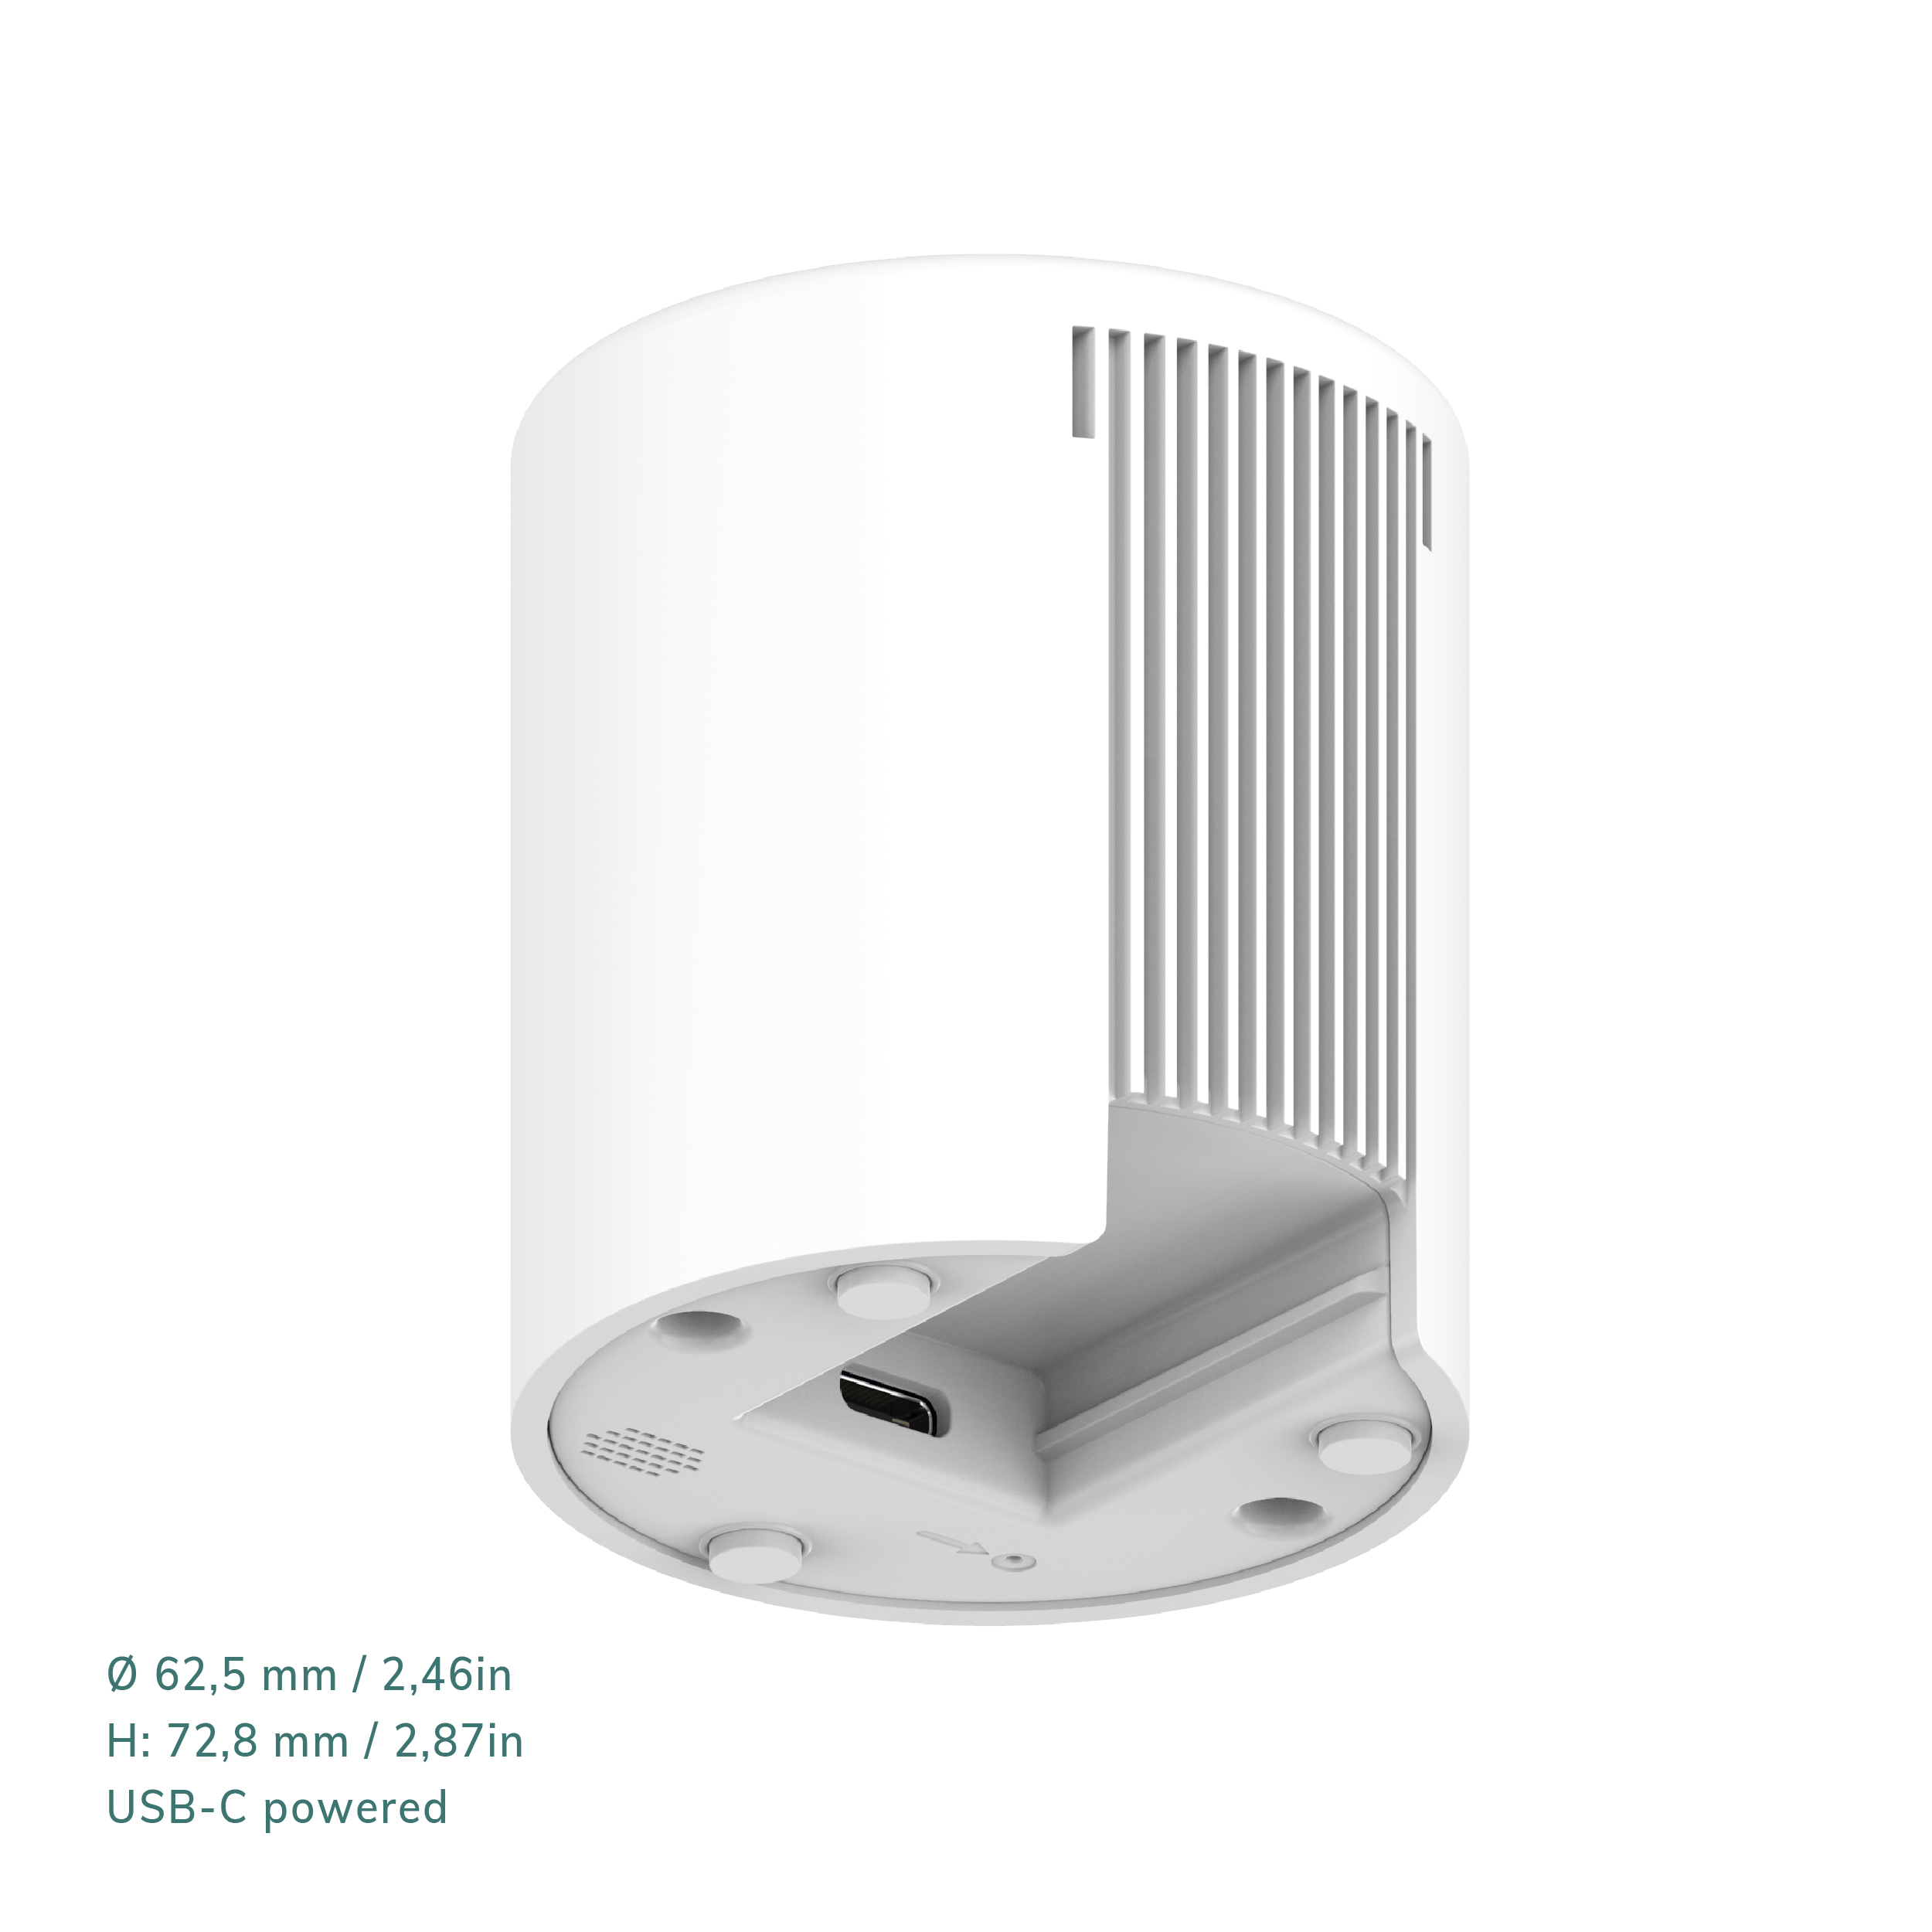
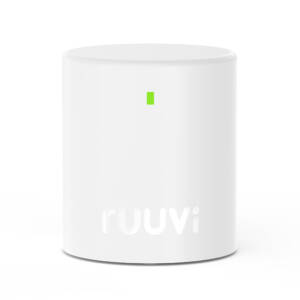
You can easily check the air quality status from the device’s color-coded light indicator. The color corresponds to the Ruuvi Indoor Air Quality Score, which is also shown in the app.
Ruuvi Indoor Air Quality Score
The Ruuvi Indoor Air Quality Score (IAQS) is a single number from 0 to 100 that summarises how good or poor your indoor air quality is. It is based on two key factors: levels of fine particulate matter (PM2.5) and carbon dioxide (CO₂).
Onboard Sensors (7-in-1)
Carbon Dioxide (CO₂): ppm, typical accuracy ±50 ppm + 2.5% from 400 ppm to 1000 ppm, ±50 ppm + 3% from 1001 ppm to 2000 ppm, ±40 ppm + 5% from 2001 ppm to 5000 ppm. Range: 0-40000 ppm. High CO₂ levels can cause fatigue and reduce concentration. Monitoring helps you know when it’s time to ventilate.
Particulate Matter (PM): µg/m³, typical accuracy for PM1 and PM2.5: ±5 µg/m³ + 5% for range 0-100 μg/m³, ±10 % for range 100-1000 µg/m³, and typical accuracy for PM4 and PM10: ±25 µg/m³ for range 0-100 µg/m³ and ±25 % for range 100-1000 µg/m³. Range: 0–1000 µg/m³. Fine particles can enter your lungs and affect your health without noticeable symptoms. The sensor shows how clean your air really is.
VOC: The VOC Index mimics the human nose’s perception of odors with a relative intensity compared to recent history. The VOC Index is also sensitive to odorless VOCs, but it cannot discriminate between them. On the VOC Index scale 0-500, this offset is always mapped to the value of 100, making the readout as easy as possible: a VOC Index above 100 means that there are more VOCs compared to the average (e.g., induced by a VOC event from cooking, cleaning, breathing, etc.) while a VOC Index below 100 means that there are fewer VOCs compared to the average (e.g., induced by fresh air from an open window, using an air purifier, etc.).
NOx: All NOx events are quantified on the same limited scale of the NOx Index, ranging from 1 to 500. In contrast to the VOC Index, there is no gain adaptation for the NOx Index because the gas composition of NOx events usually does not vary as much as in VOC events. NOx compounds mainly come from traffic and combustion. They can irritate the respiratory system and reduce air quality, especially in urban areas.
Temperature: °C, °F, K; typical accuracy ±0,45 °C at 15–30 °C (±0,81 °F @ 59–86 °F). Temperature directly affects comfort and energy usage. It’s a key part of indoor air quality.
Air humidity: Relative humidity (%), absolute humidity (g/m³) dew point; typical accuracy ±4,5 % at 30-70 %. Humidity influences breathing, sleep quality, and even building health. Both too dry and too humid air can cause problems.
Air pressure: Pa, hPa, mmHg, inHg; accuracy ±1 hPa. Range: 500–1155 hPa. Changes in air pressure can impact how you feel and help interpret other environmental shifts. It may also relate to headaches or fatigue.
Basic Specifications
Operating temperature: +10 °C to +40 °C (50 °F to 104 °F), for indoor use in non-condensing environments.
Housing: Polycarbonate
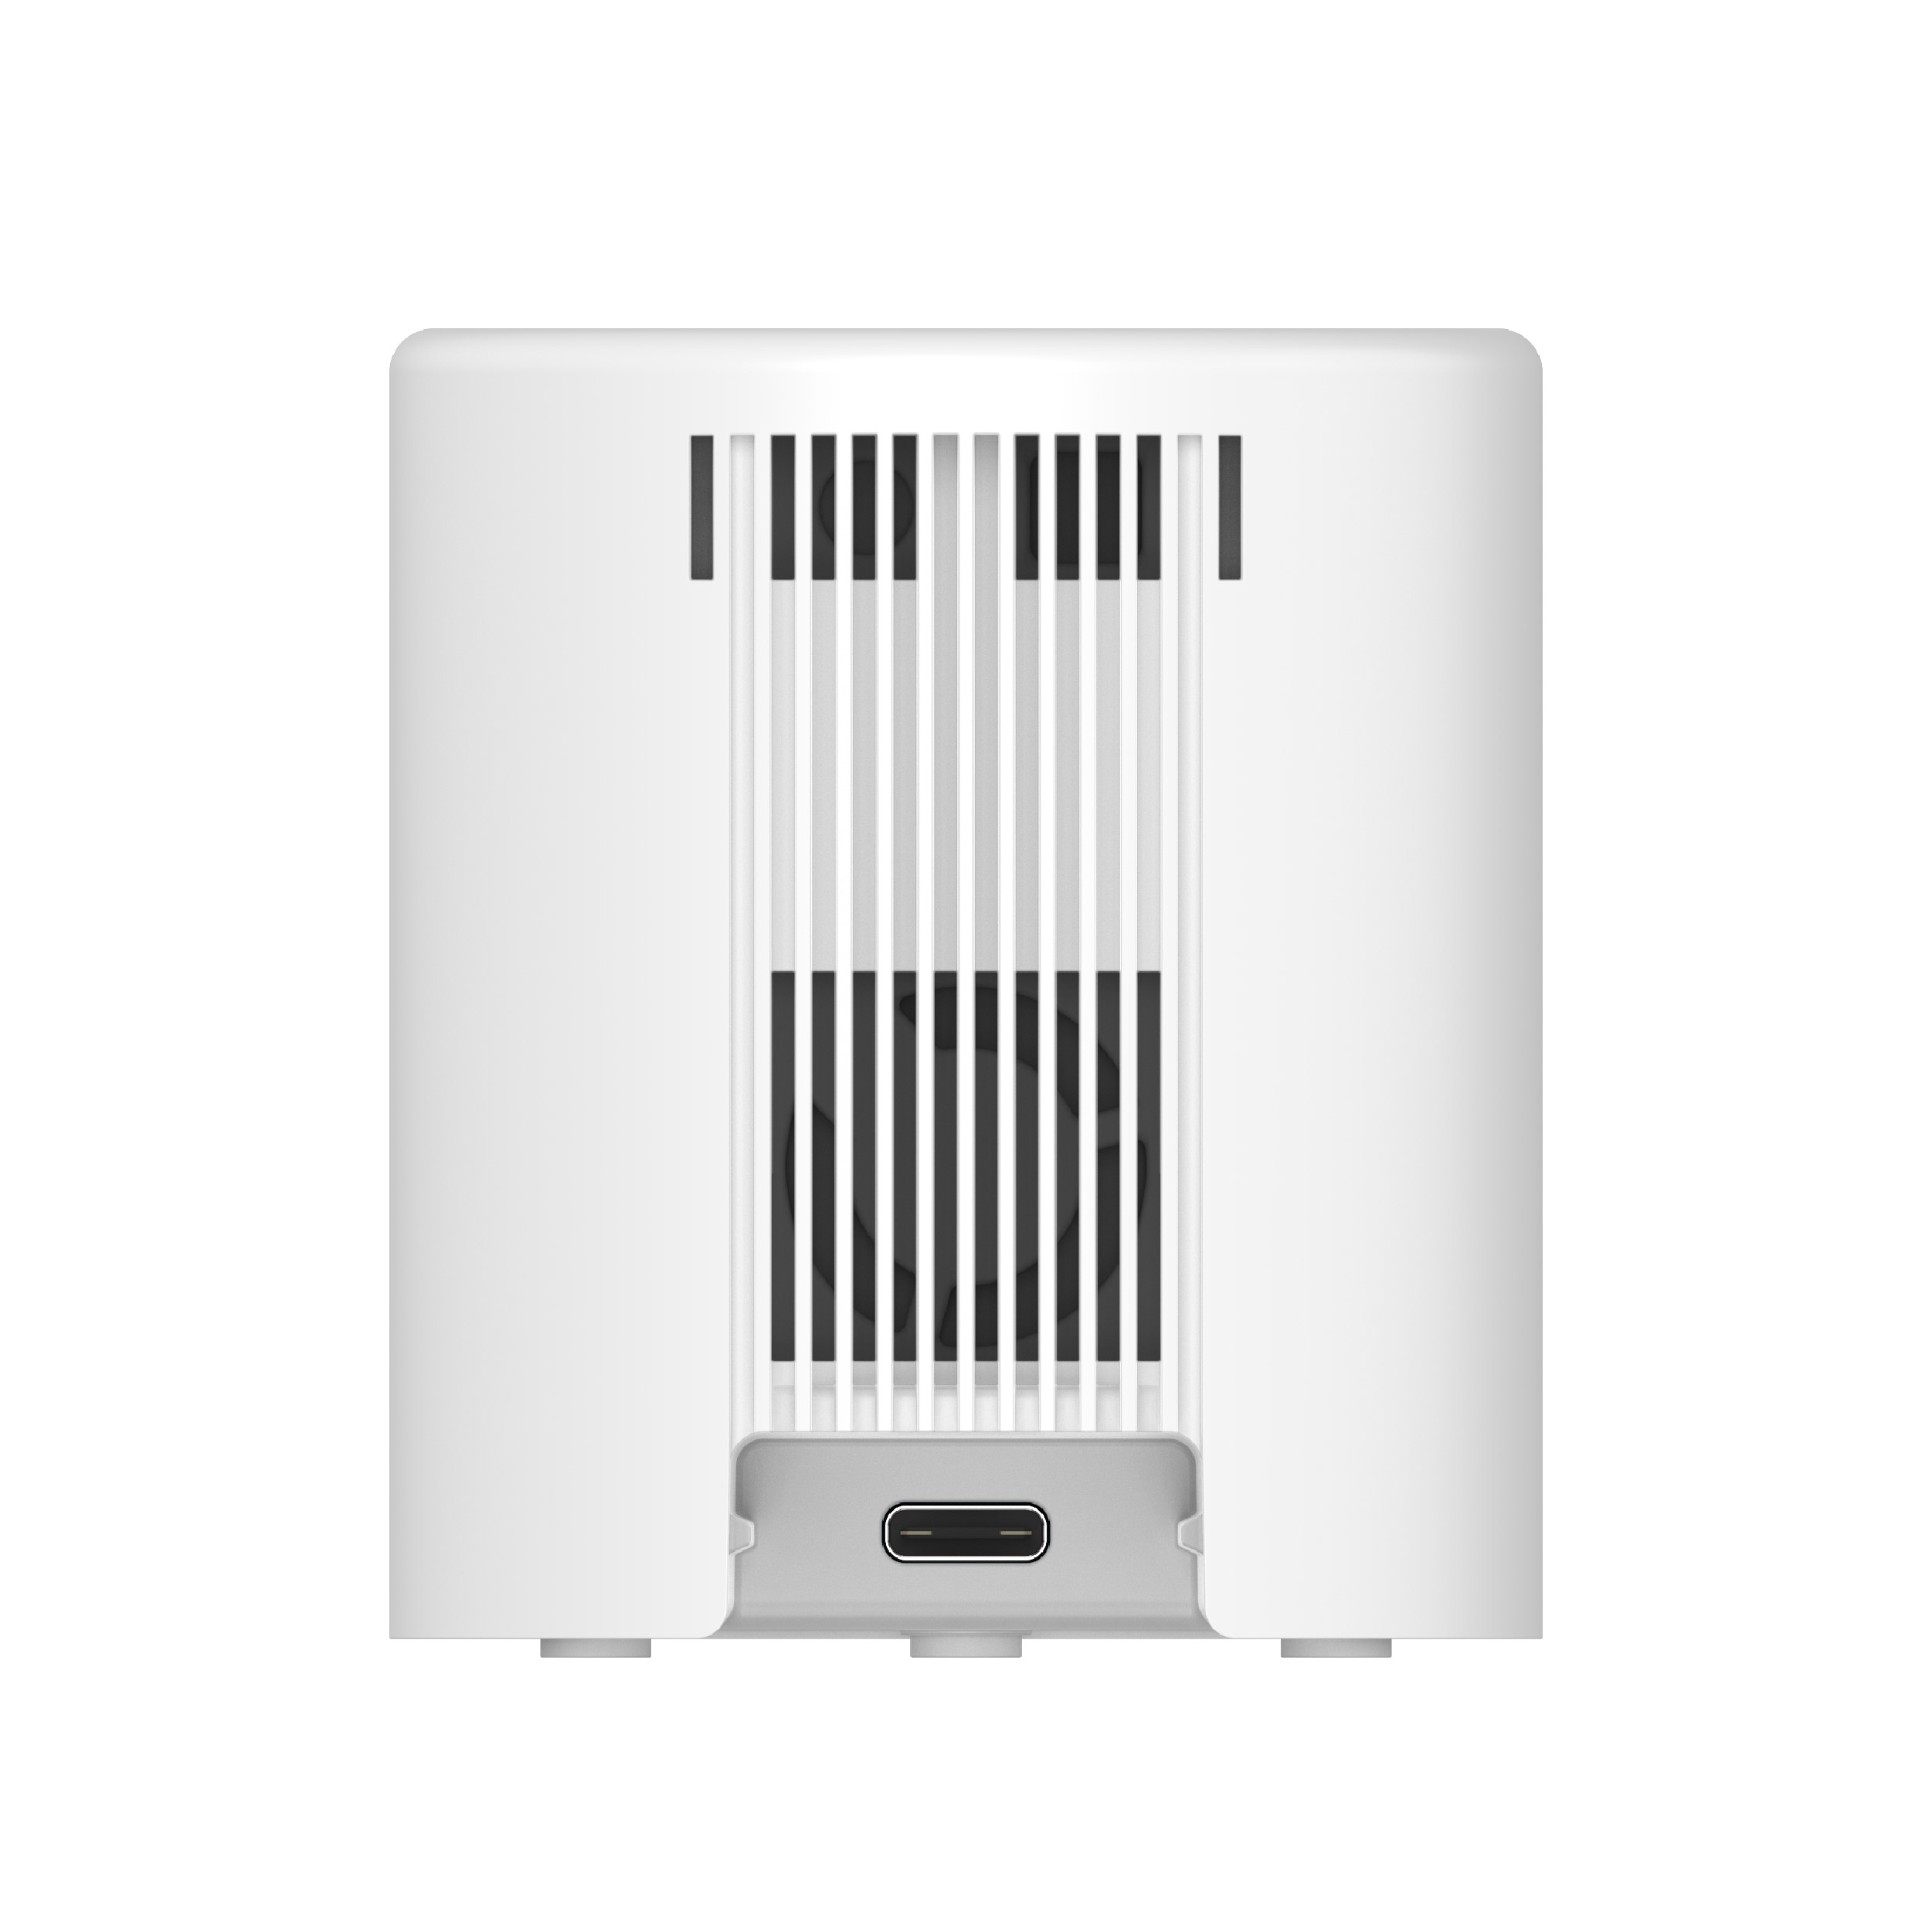
Power: 5V 500mA USB-C
Certifications: CE, FCC, RoHS, ISED, RCM
Bluetooth range: 5-20 meters (indoor). The sensitivity of the receiving mobile device’s antenna, obstacles and wall materials affect the range. For increased range, use the Ruuvi Gateway router as a receiver.
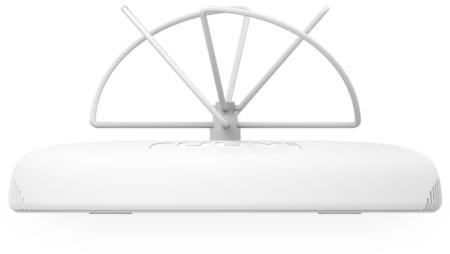
Fan: Ruuvi Air contains a small fan, which is an essential part of the sensor system. You may notice a faint sound when the device is powered on and operating.
Mobile App Features
Free and easy: User-friendly free app, signing in is optional
Platforms: Android and iOS
Alerts: Configurable Bluetooth push alerts with customisable messages
Tailored tips: Get practical tips to improve your indoor air quality
Real-time measurements: Track data in real time
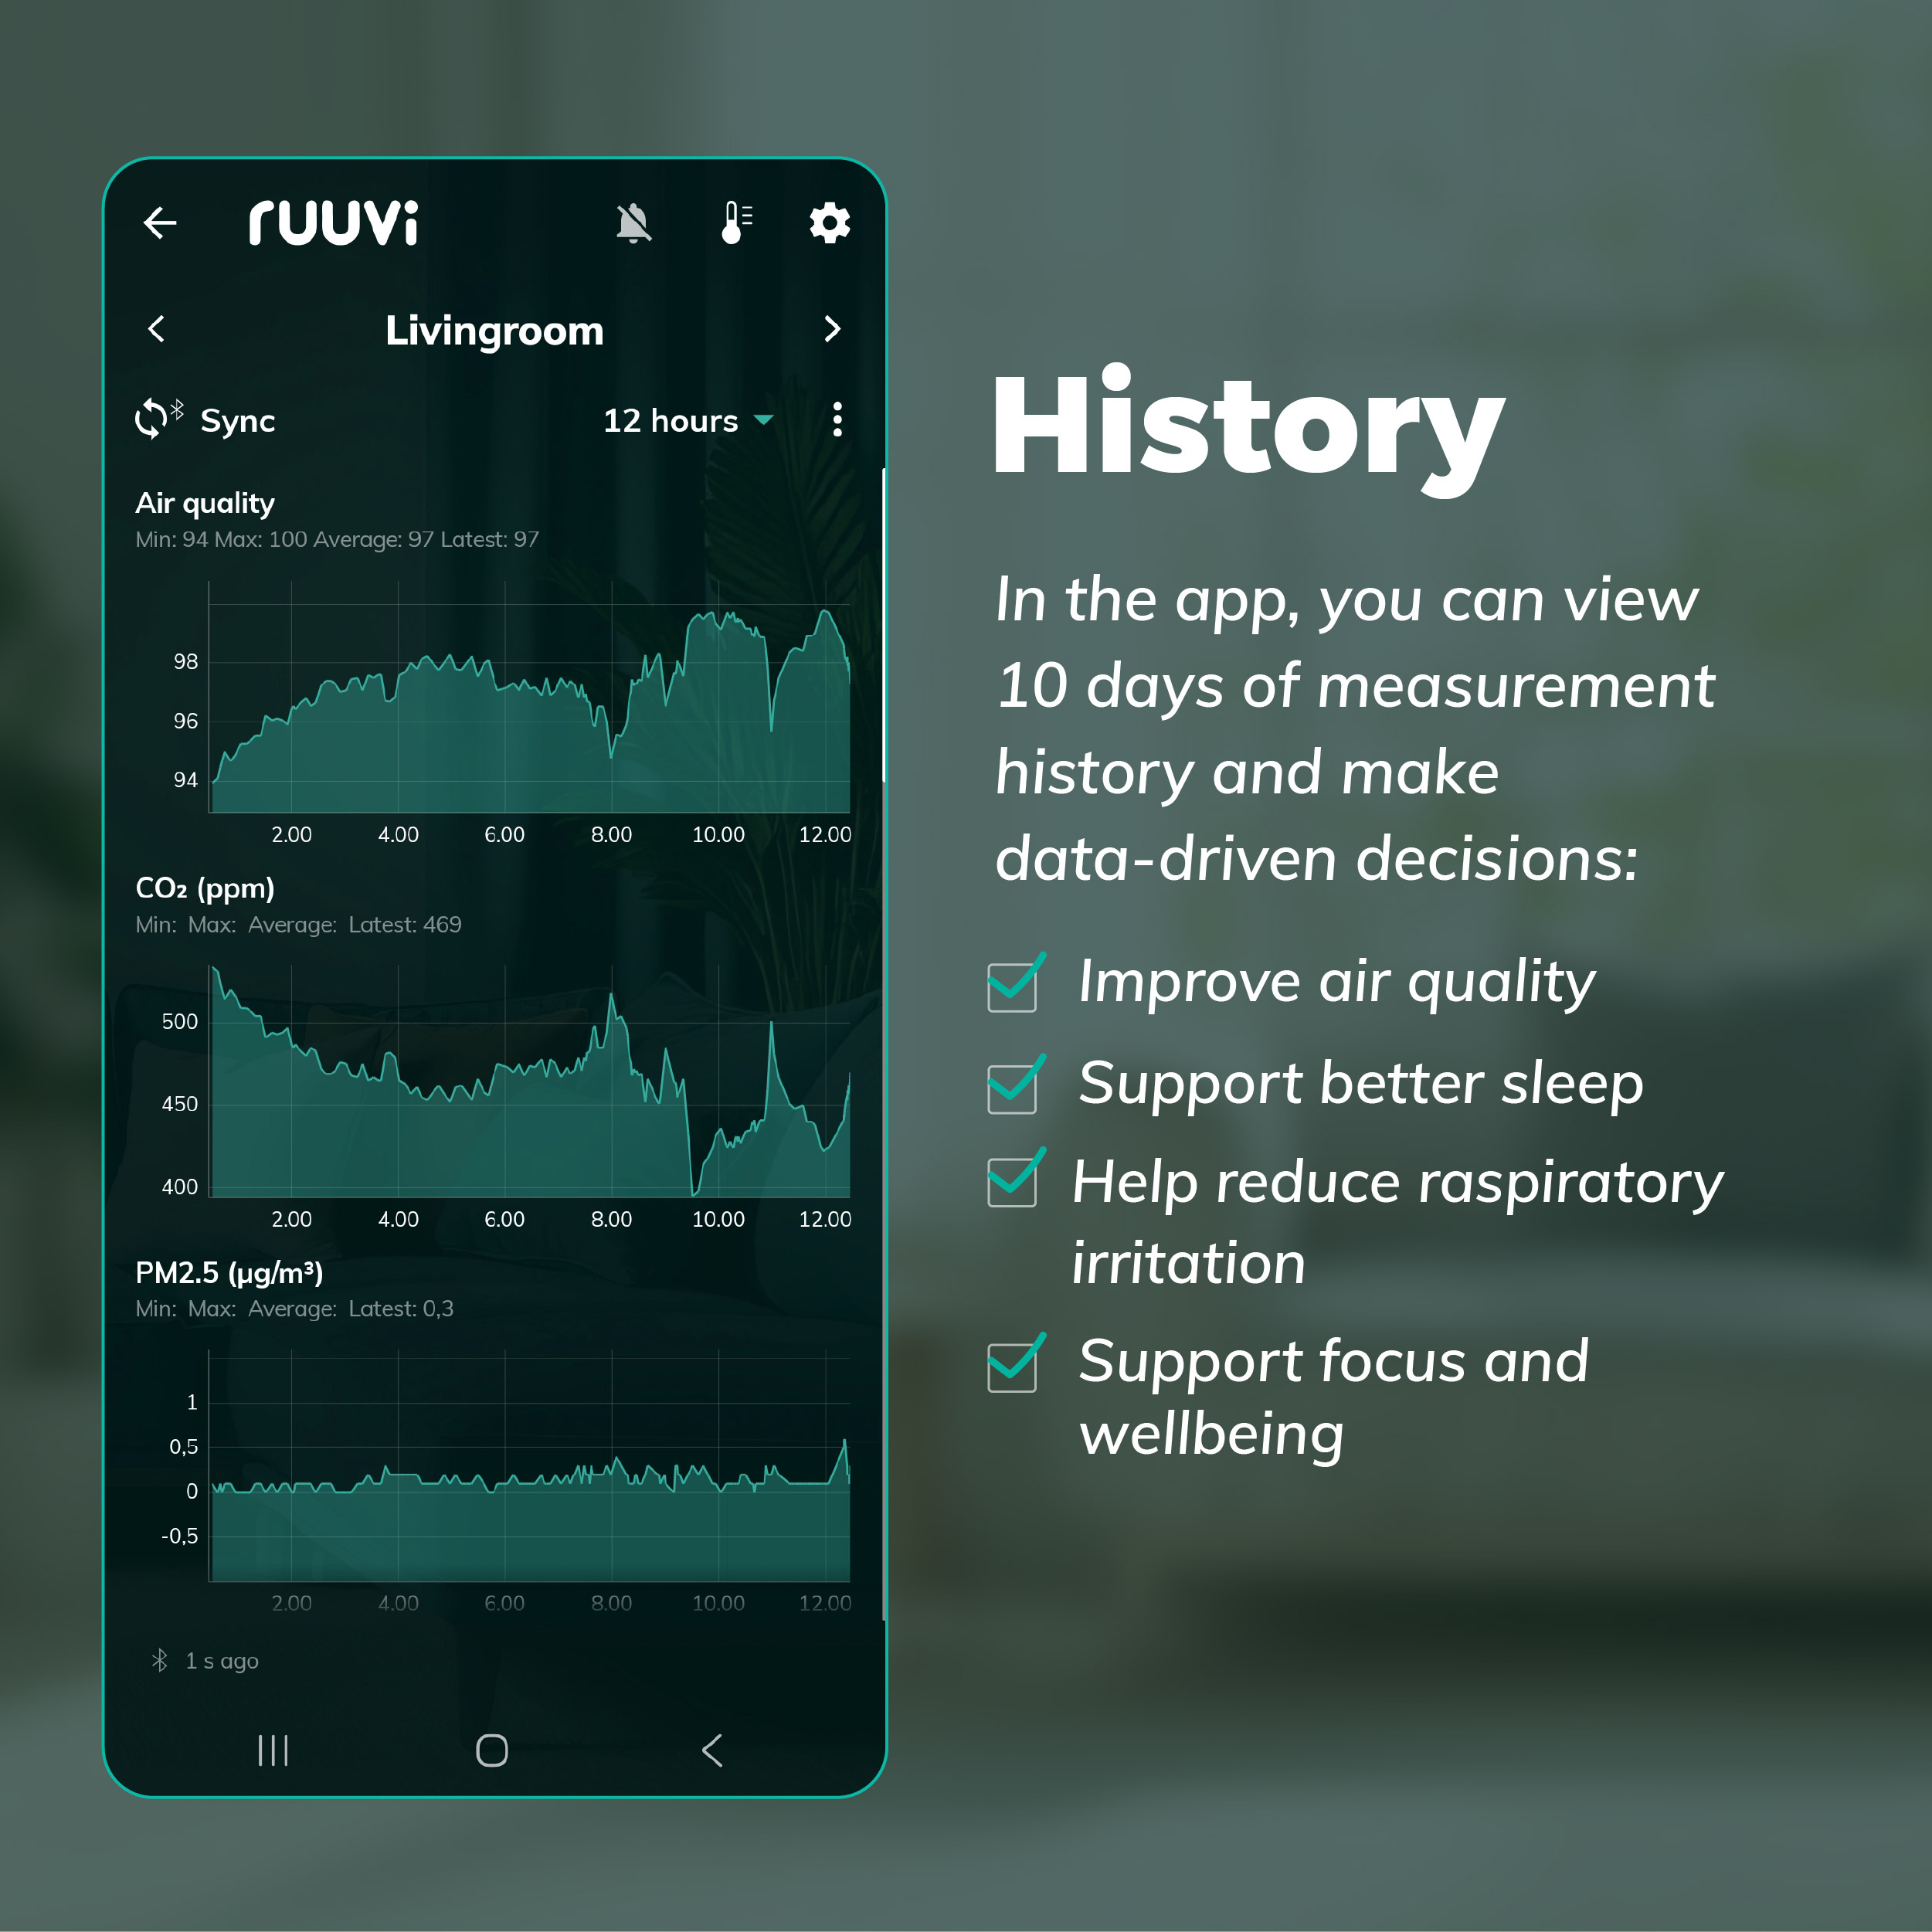
Historical data: Detailed historical graphs available for up to 10 days (offline)
History export: 10-day history export
Dashboard: See all your sensors at a glance
Personalise sensors: Use custom backgrounds and names
Multilingual: Available in English, Finnish, Swedish, French, and German
Compatibility
Integrations: Home Assistant (more coming)
Remote monitoring: When not within Bluetooth range, online remote monitoring is available with the Ruuvi Gateway and Ruuvi Cloud, both sold separately.
Included in the Package
- Ruuvi Air sensor device
- 2 m USB-A to USB-C power cord
- 5V 1A USB-A Europlug wall adapter (110-230V)
- Quick start guide
Technical Specifications
Datasheet: Download datasheet (pdf)
Read more info below:


An amazing product with such a wide variety of sensors. I love it and bought two more for my family to monitor their bedroom and offices.
Easy to install, provides very relevant data. Nice view in the app!
Very useful and very easy to use!
A nice little “toy” from Ruuvi that does a serious job. Didn’t know the air in my (home) office was so bad. Now I see the air quality status and know it’s time for some fresh air. Could explain some of my headaches after a long day.
Integrated it into my HomeAssistent workflow and always have the status on my Awtrix clock.
I love this setup…
The device has worked great. The data from the device and Ruuvi’s Help Desk have increased my understanding of the importance of good air quality and how it can be influenced. I am very pleased for Ruuvi 🙂