Ruuvi Station allows you to explore your recorded measurement data with accuracy, directly within the Ruuvi Station’s History view.
Exploring measurement history in Ruuvi Station mobile
In Ruuvi Station mobile you can explore each individual graph by using pinch-to-zoom gestures and/or scroll and move through the grid from left to right or up and down by simply positioning your finger on the place where you want to start scrolling from. You can also use double tap to zoom to any XY-axis location on the grid.
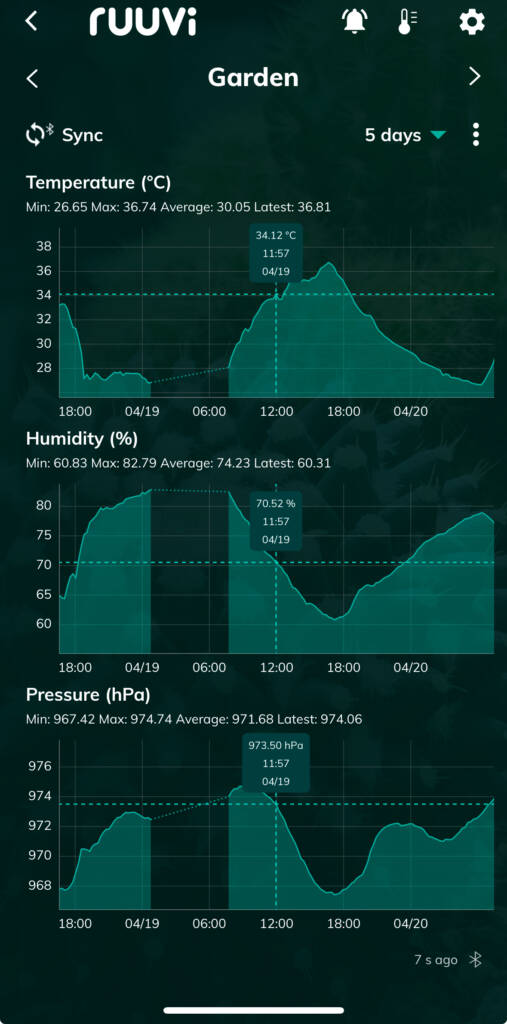
Single tap on a recorded datapoint in the graph will show detailed information regarding that specific datapoint and shows the corresponding datapoint in the other visible graphs.
Selecting a view in Ruuvi Station mobile
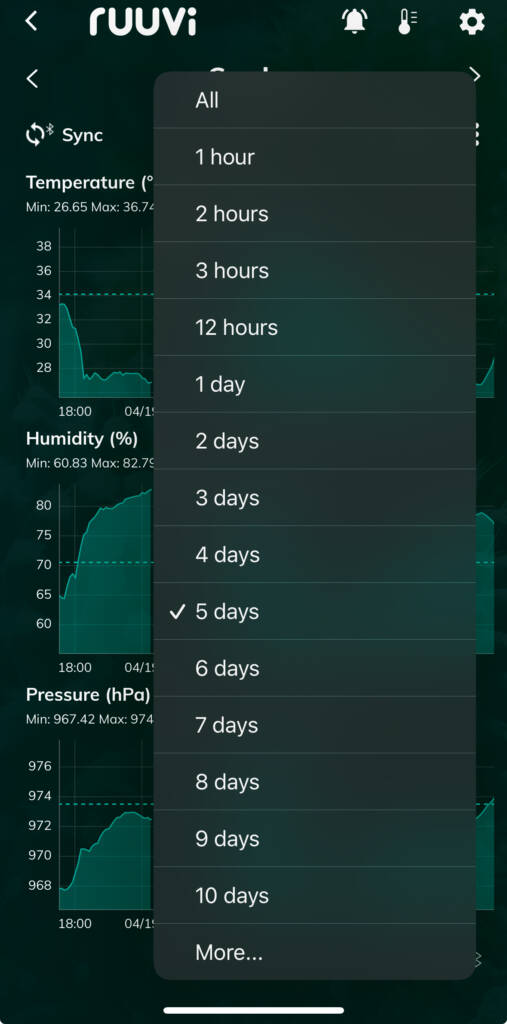
You can choose a specific timeframe to be shown in history view by choosing the desired option from the dropdown menu. Maximum 10 days history is available in Ruuvi Station mobile app.
Exploring measurement history in Ruuvi Station web
In Ruuvi Station web you can explore the selected chart by dragging and selecting a desired area with your mouse. You can use double click to reset zoom back to 100%.
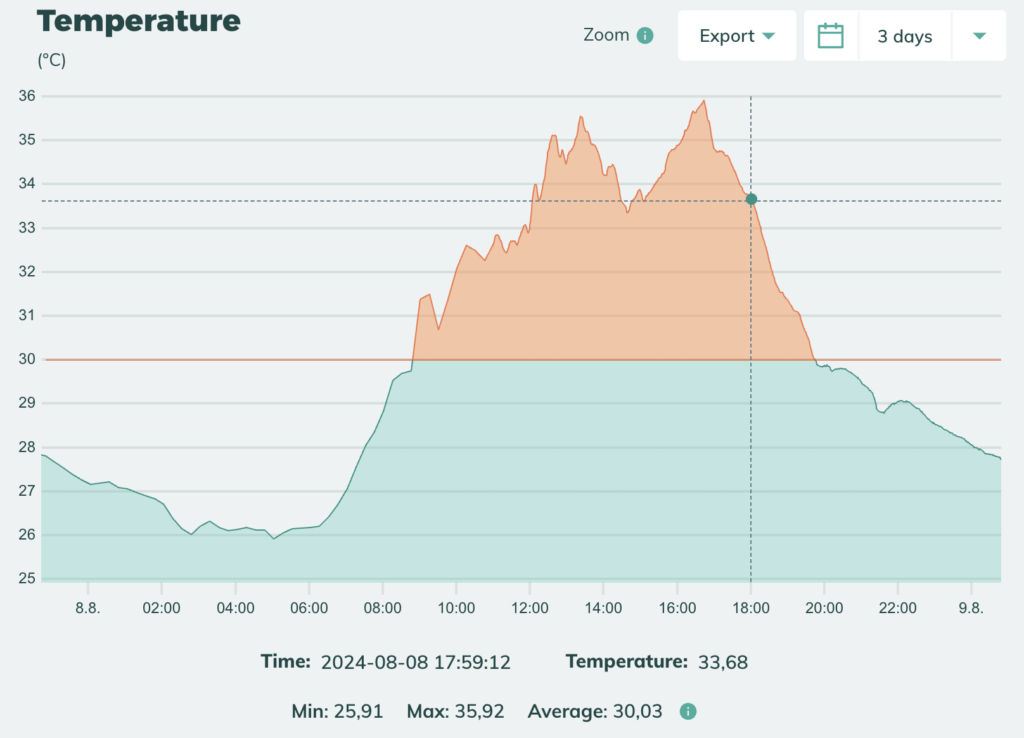
Moving your mouse pointer on the chart will show detailed information regarding that specific datapoint under the chart as well as minimum, maximum and average values for the visible timeframe.
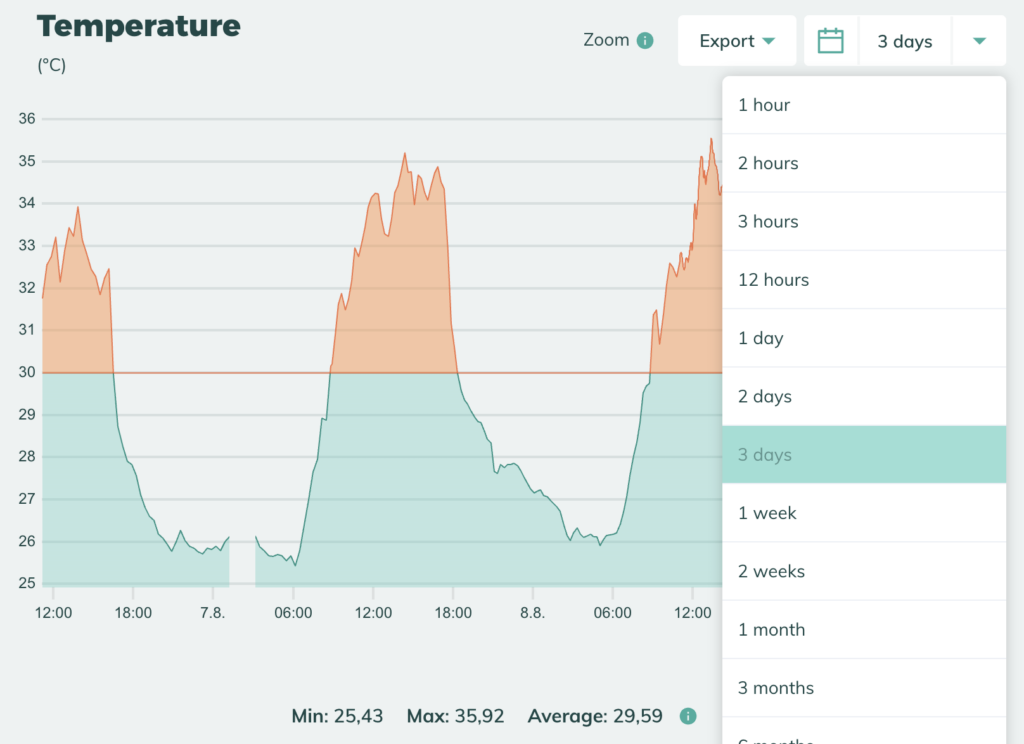
Selecting a view in Ruuvi Station web
You can choose a specific timeframe to be shown in history view by choosing the desired option from the dropdown menu. Ruuvi Station web allows you to view up to 3 years of measurement history. The maximum available history length depends on your subscription.