
A while ago we made a blog post about monitoring motor operation with RuuviTags. The firmware built then had a design goal of collecting raw data out of monitored target for further analysis. While the firmware works well for the data collection, it consumes a lot of power and requires manual work to process the data.
In this post we develop the concept a bit further and process the data on RuuviTag and broadcast peak-to-peak root mean square and standard deviation of the data.
Collecting the data
Data collection is simple continuation of the previous part, we collect data at 400 Hz and wait until first-in-first-out (FIFO) full interrupt comes from the accelerometer LIS2DH12. Then we read out the FIFO data, and calculate peak-to-peak (P2P), root-mean-square (RMS) and standard deviation (STDEV) of the data.
The calculated values are then encoded as UINT16_T into manufacturer specific data format which is broadcast as Bluetooth Low-Energy (BLE) advertisement. Any nearby BLE device can then hear and parse these broadcasts. We start the packet with a header byte 0xAC, version byte 0x00, and then have X-Y-Z values of P2P, RMS and STDEV. Finally we add a sequence counter which can be used to detect missing packets and battery voltage to warn us when it’s time to change the battery.
Receiving the data
The data is parsed with the Typescript / NodeJS collector made for the battery endurance testing and the code is run on Raspberry Pi. You can get the sources from Github, please note that Noble library has issues on NodeJS 10+ as of January 2019. You can run the code with NodeJS 8 under NVM. Parsed data is then sent to InfluxDB and rendered with Grafana.
Power consumption
Once again, we’ll need to consider the power consumption of the tag. It’s not good enough to have the tag work as expected, it has to work for a long time.
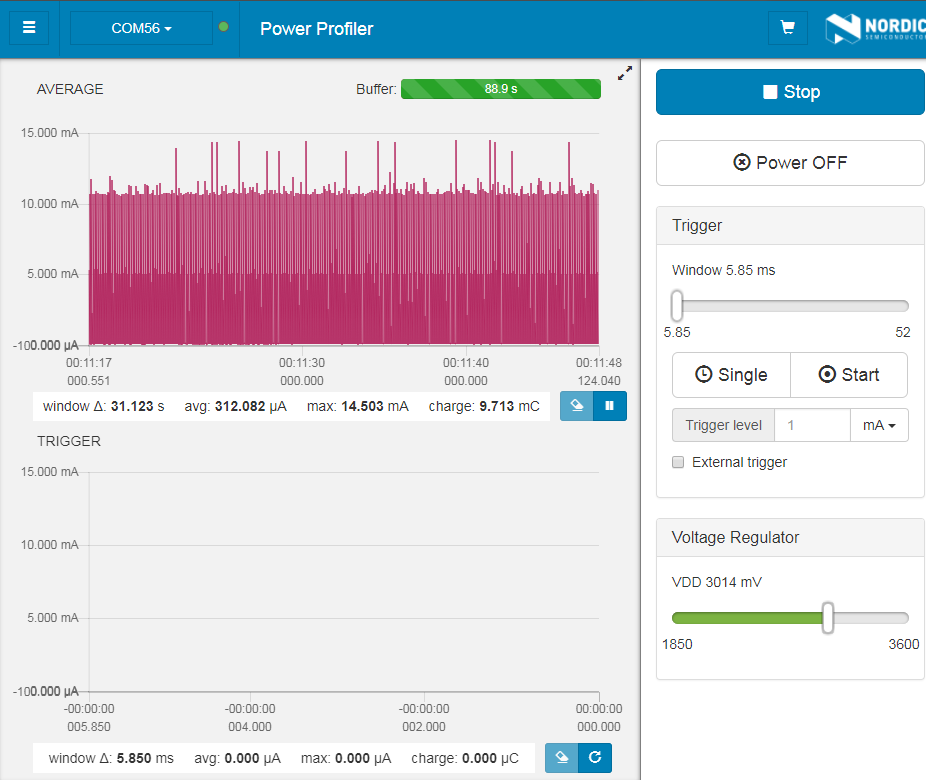
The current consumption is way too high right now, at 300 µA we can expect maybe 4 months of battery life. This is obviously not enough, so lets see what we can do about it.
Optimizing the firmware
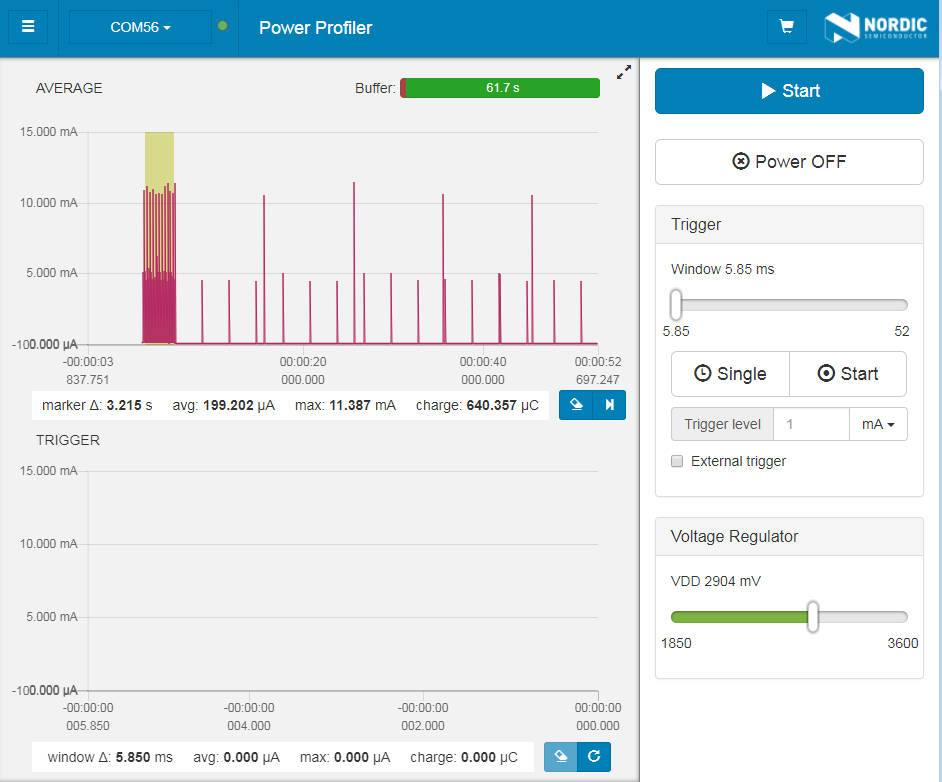
Right now the sensor is broadcasting data as fast as BLE specs allow regardless of if there is anything interesting. First thing to optimize is to monitor the activity level, and enter a standby mode if there is nothing interesting going on. Our standby mode has a broadcast interval of 9900 ms and accelerometer sampling of 10 Hz.
If there is an acceleration event which exceeds the predefined threshold during standby, an interrupt is triggered and sensor switches back to 400 Hz mode. We set the interrupt threshold to 50 mg, which will be rounded up to 64 mg because of the sensor limits.
Additionally we combine 4 sets of FIFO results into one calculation, as this allows us to reduce the broadcast rate into 400/128 Hz or approximately 320 ms.
Now our firmware should be good to go for longer term, but we’ll naturally verify it.
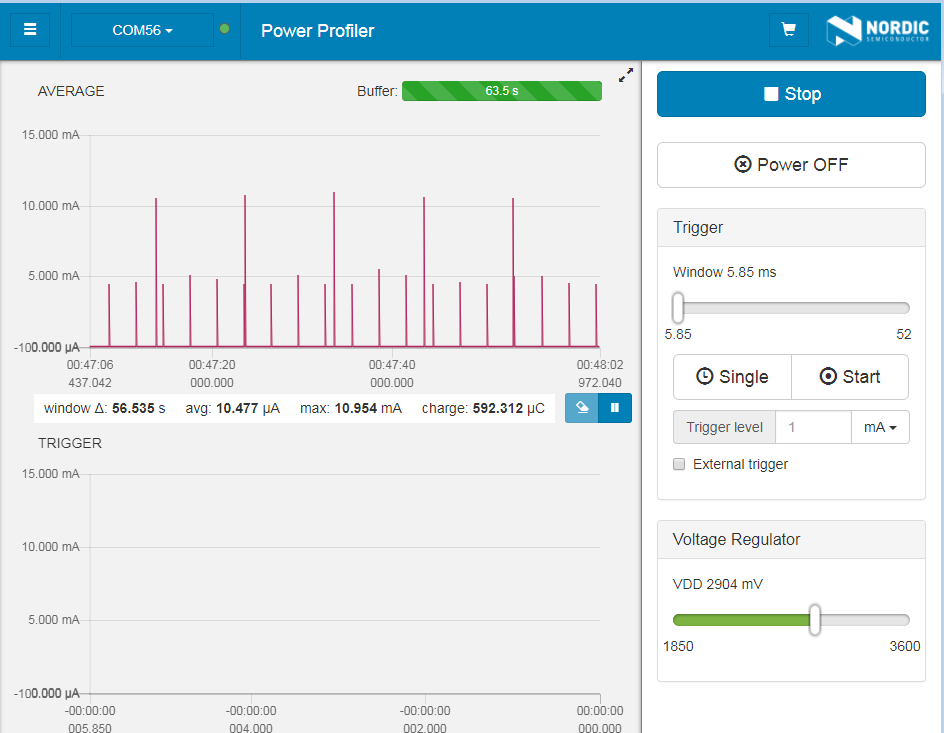
The standby current consumption suggests that we could have ten years of standby time, that’s definitely enough. However, the 200 µA of current consumption at active state would consume the battery in approximately six months. This is quite OK for a household appliance which is infrequently on, such as a laundromat. A refrigerator which has continuous starts of the compressor might require more tuning, for example by taking one sample set for every 10 seconds of activity. On the other hand, some other device such as a computer numerical control(CNC) machine might benefit from continuous monitoring. The application can be further fine tuned for the specific use-case.
Trying it out
As before, we use laundromat as a household device to be monitored. A 3M VHB double-sided tape is used to attach the tag on the side of the laundromat.
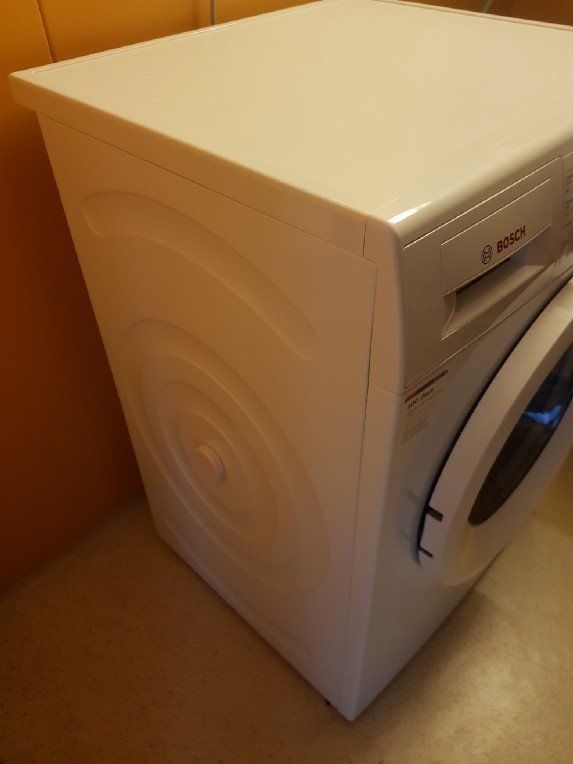
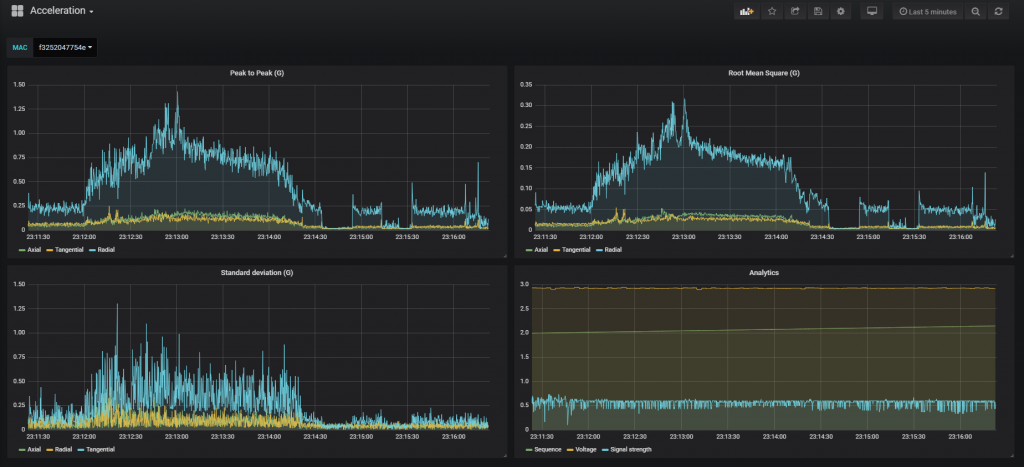
The accelerometer is internally aligned so that X-axis becomes axial acceleration and Y axis becomes tangential acceleration Z is “naturally” radial acceleration as the Z-axis is aligned towards the center of the drum. Then we engage a wash cycle and wait for the results.
Coincidentally, we have an anomaly in our run. An ironing board fell on the laundromat while I was taking a picture of the setup.
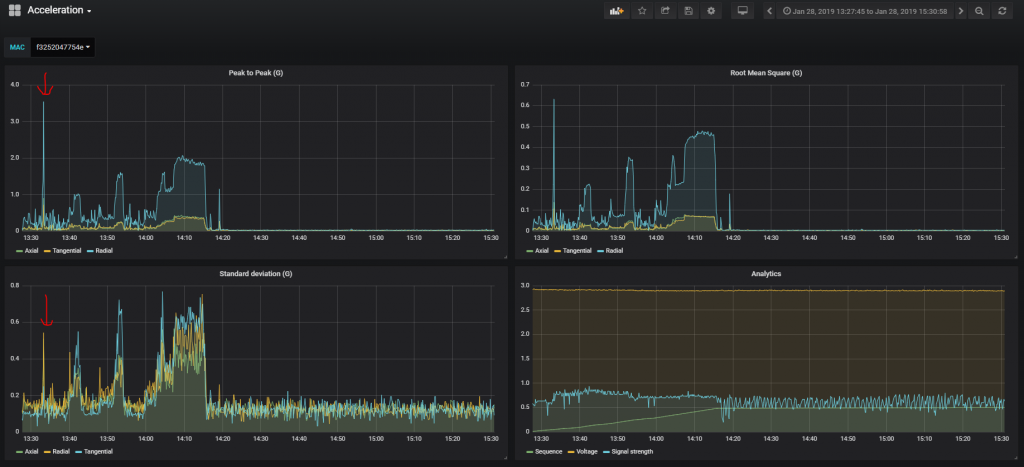
It’s easy to spot the acceleration spike caused by the laundry board.
Conclusion
We have now a simple vibration monitoring firmware ready for some field testing. If you’re willing to try it out the sources and compiled binary are on GitHub. As before, we won’t be providing a ready made DFU packet as the firmware uses Nordic SDK15 and SoftDevice 6, whereas RuuviTags use SoftDevice 3. While the RuuviTags can be updated over the air, returning them to original programming is not possible without wired connection.